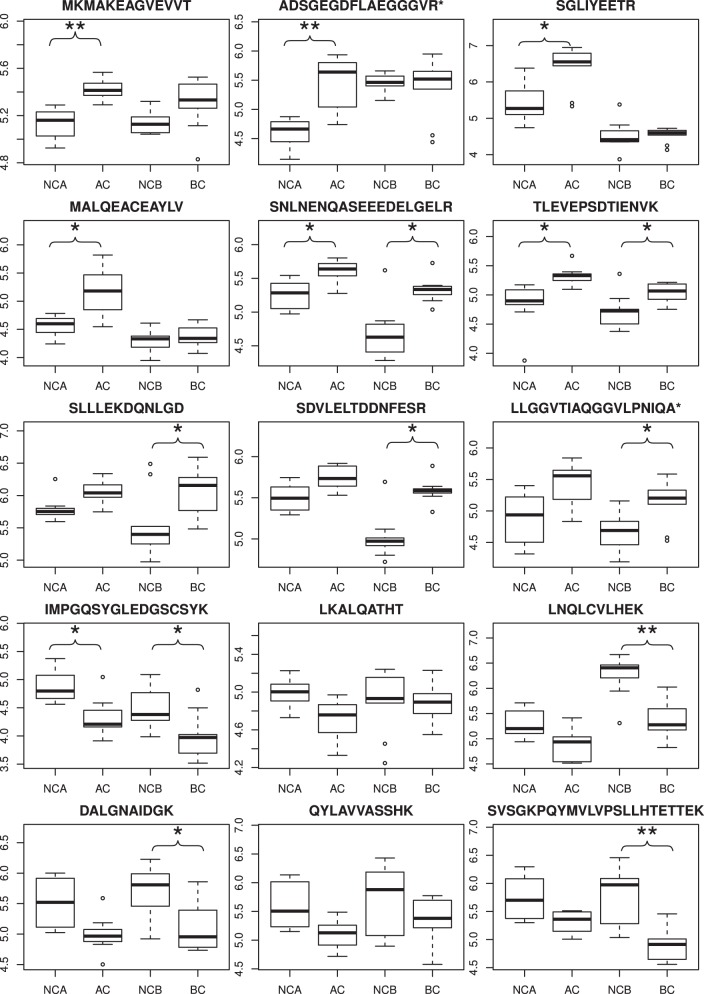
Fig. 7.
Nonpooled sample series analysis of 10 adenocarcinoma (AC) samples and 10 bladder cancer (BC) samples. Box-plots representing peptide abundance for AC versus control samples (NCA) and BC versus control tissue (NCB) for selected VIATC consensus peptides. Boxes denote interquartile range whereas whiskers extend to the most extreme data point which is no more than 1.5 times the interquartile range from the box. Asterisks denote * - q<0.05, ** - q<0.01.

