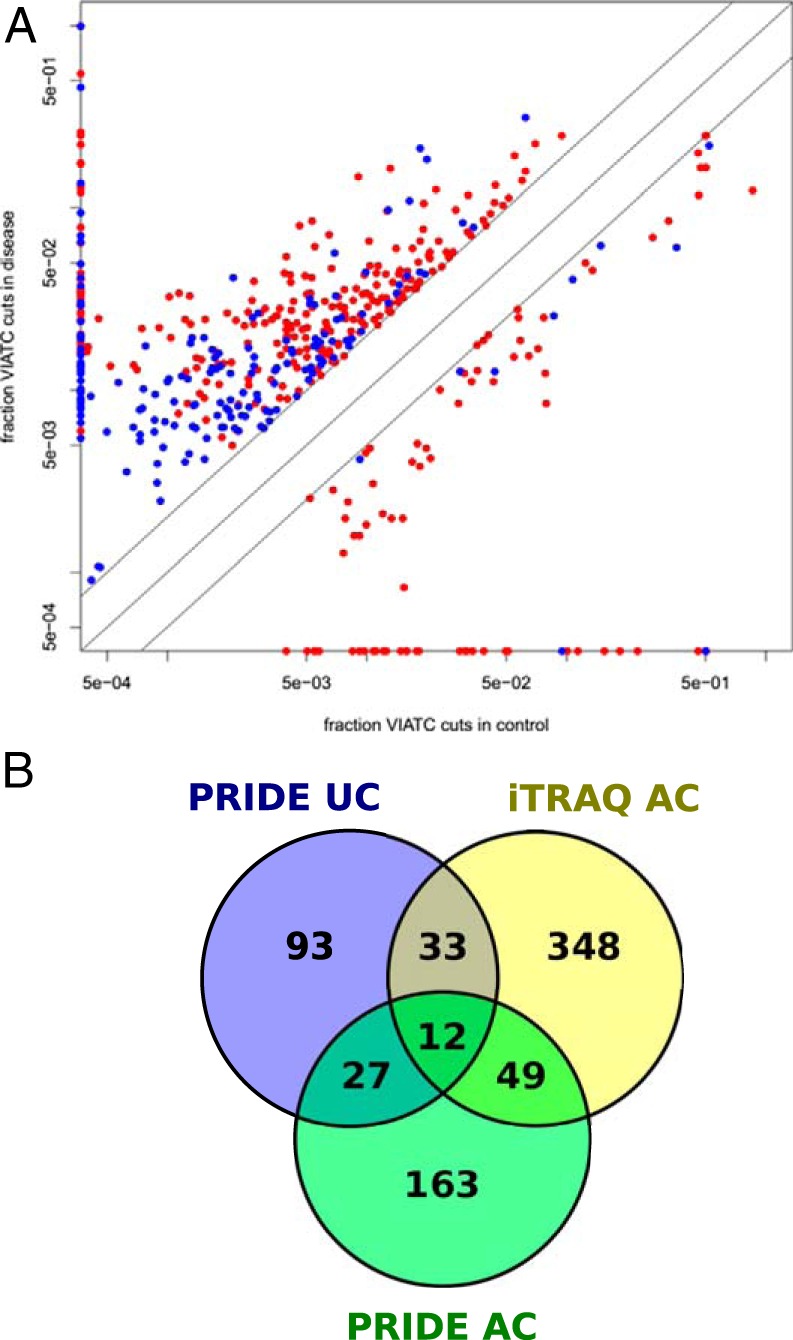
Fig. 8.

A, Fraction of queries assigned to VIATC peptides (qVIATC/qTotal) for a subset of PRIDE database proteins in disease (vertical axis) and control samples (horizontal axis) for adenocarcinoma (AC; red) and ulcerative colitis (UC; blue). Data for proteins characterized by the presence of more than 10 VIATC queries are shown. For clarity, data from proteins with a qVIATC/qTotal between 0.5 and 2 are not shown. Proteins marked on the vertical axis had no VIATC queries in control samples, whereas proteins marked on the horizontal axis had no VIATC queries in disease samples. Note the higher number of proteins with qVIATC/qTotal >2 (placed above the diagonal) than qVIATC/qTotal <0.5 (placed below the diagonal) in disease samples, both AC and UC. Also note the significantly lower average fraction of VIATC cleavages in UC than AC. B, Venn diagram illustrating number of common and unique proteins containing significantly overrepresented VIATC-cleaved peptides in iTRAQ adenocarcinoma, PRIDE adenocarcinoma and PRIDE ulcerative colitis data set. Note 49 proteins commonly identified in iTRAQ and PRIDE adenocarcinoma data set and absent in ulcerative colitis data set.
