
Figure 5.
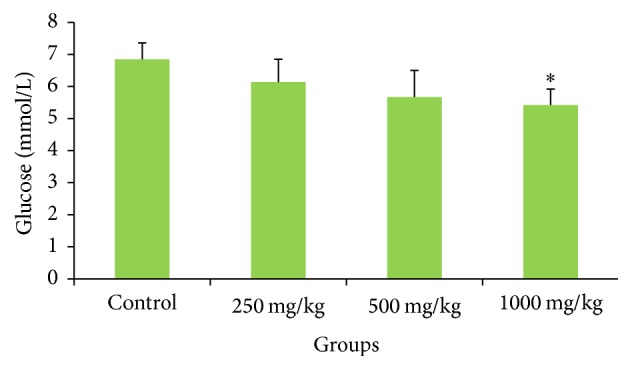
Effects of G. pedunculata fruit extract on blood glucose levels. Values are expressed as the mean ± SD (n = 6). ∗ denotes a significant difference when compared to the control group.
Official websites use .gov
A
.gov website belongs to an official
government organization in the United States.
Secure .gov websites use HTTPS
A lock (
) or https:// means you've safely
connected to the .gov website. Share sensitive
information only on official, secure websites.
Effects of G. pedunculata fruit extract on blood glucose levels. Values are expressed as the mean ± SD (n = 6). ∗ denotes a significant difference when compared to the control group.