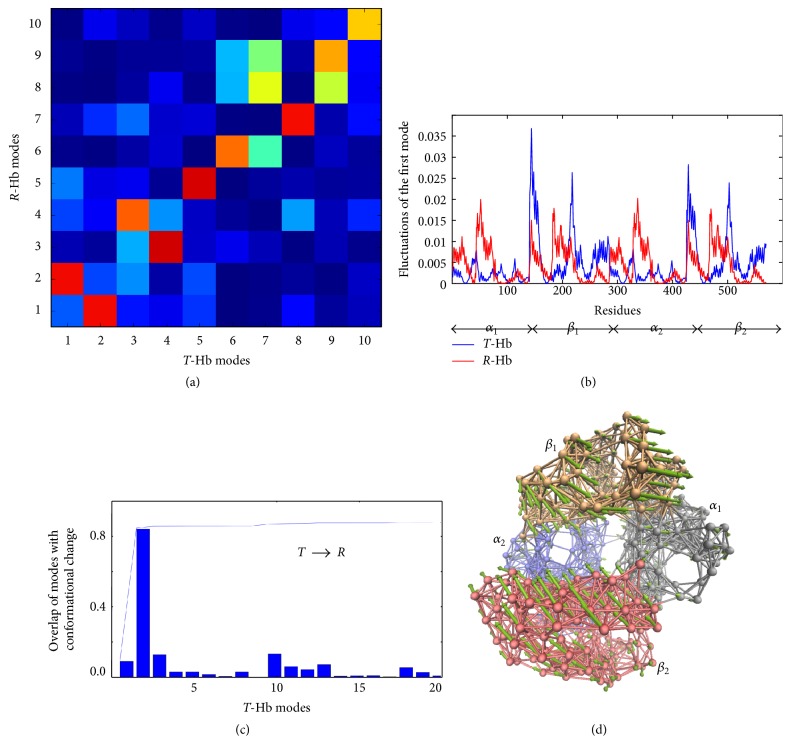
Figure 2.
ENM results for T → R transition of tetrameric Hb. (a) Overlaps between the ten slowest ANM modes of T- and R-Hbs. (b) Distribution of mean-square fluctuations obtained by the first ANM mode of T- and R-Hbs. The residue index of the four chains is 1–140 (α1), 141–285 (β1), 286–425 (α2), and 426–570 (β2). (c) Overlaps of individual T-Hb ANM modes with the conformational change within T → R transition. (d) The motion of the second ANM mode of T-Hb; here the protein is represented as a network.

