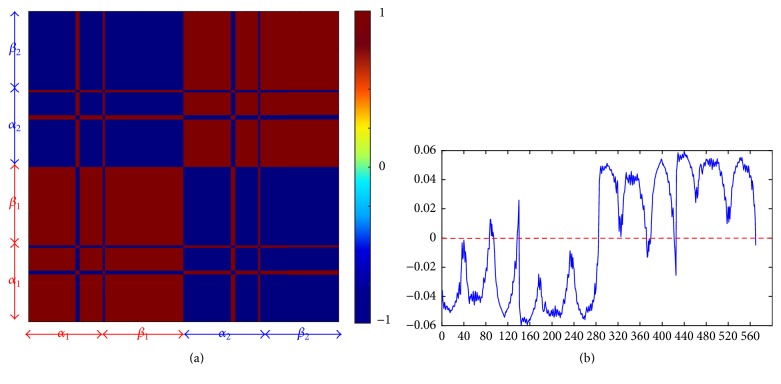
Figure 3.
Modular analysis of T-Hb based on GNM. (a) The correlation map corresponding to the first mode divides the Hb into two modules. Red regions correspond to collective residue motions and blue-colored regions correspond to uncorrelated motions. (b) The shape of the first mode, which not only shows two modules but also predicts hinge sites.

