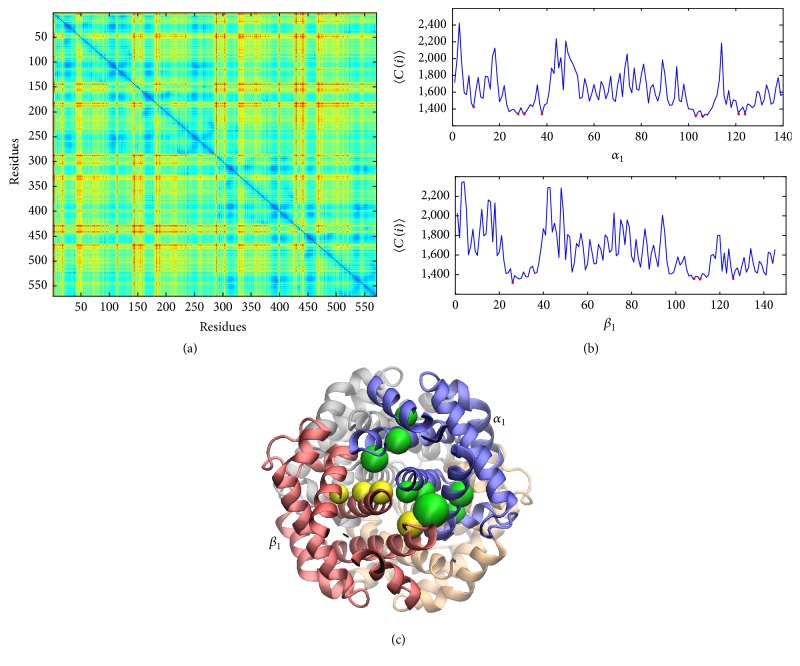
Figure 4.
Signal propagation of residues for T-Hb. (a) The commute time map of T-Hb. Minimal of average commute time profiles (red circles) for α1 chain and β1 chain (b) indicates that most of residues with highest communication abilities (green beads in α1 chain and yellow beads in β1 chain) distribute at α1-β1 interface (c). Results are presented for 2dn1 (T), and 2dn2 (R) and 2dn3 (R2) showed similar behavior.

