Figure 5.
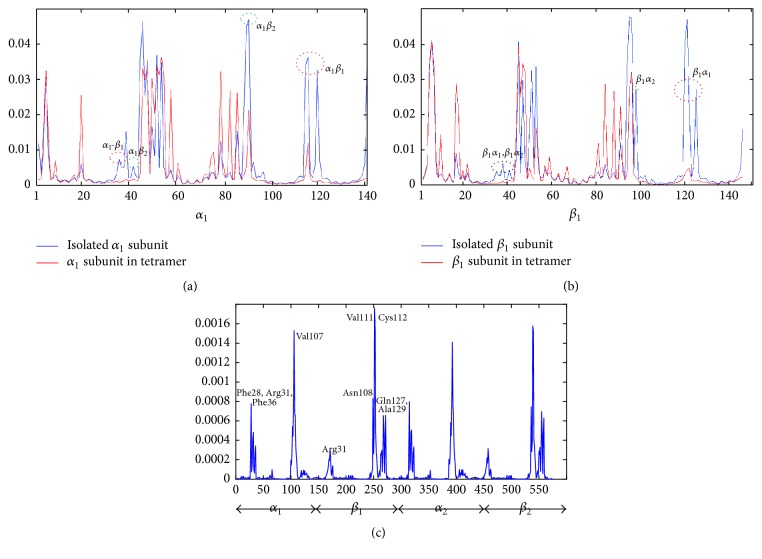
Square fluctuations of Hb monomers and tetramers. (a) Square fluctuations of α1 subunits in isolated and tetrameric states based on the first 20 ANM modes. The differences of mobilities at α1-β1 and α1-β2 interfaces are indicated by red and green circles. (b) Square fluctuations of β1 subunits in isolated and tetrameric states based on the first 20 ANM modes. Red, green, and black circles indicate the differences of mobilities at α1-β1 and α2-β1 interfaces and a common region of these two interfaces. (c) Square fluctuations of T-Hb tetramers based on the highest two modes. Hot spots are predicted by the peaks in the profile, while α1β1 and α2β2 dimer show the same prediction result.

