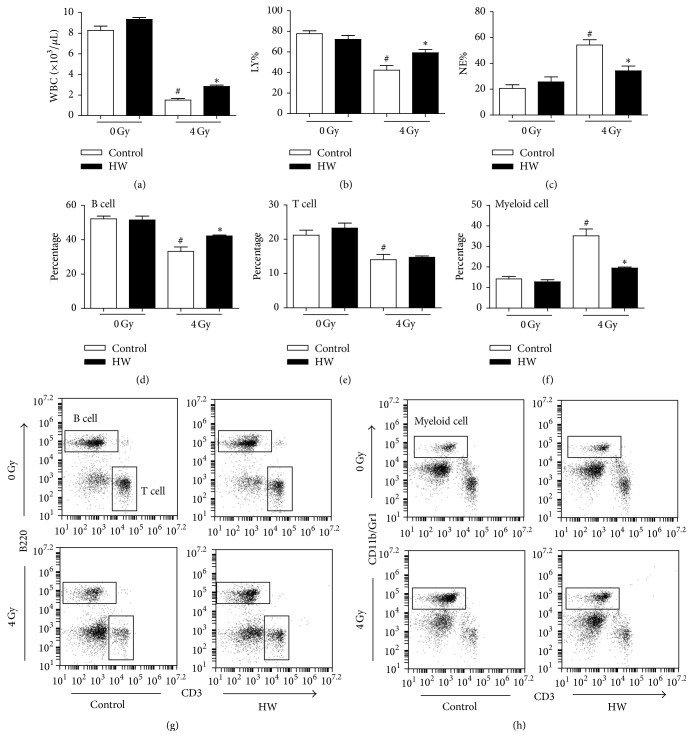
Figure 2.
HW alleviates TBI-induced differentiation dysfunction in the hematopoietic system. (a) The bar graph shows the number of WBCs in peripheral blood. (b) The bar graph shows the percentage of lymphocytes (LY) in peripheral blood. (c) The bar graph shows the percentage of neutrophilic granulocytes (NE) in peripheral blood. (d) The bar graph shows the percentage of B cells in peripheral blood, as detected by FACS. (e) The bar graph shows the percentage of T cells in peripheral blood, as detected by FACS. (f) The bar graph shows the percentage of myeloid cells in peripheral blood, as detected by FACS. (g) Representative FACS analysis showing the percentage of B cells and T cells. (h) Representative FACS analysis showing the percentage of myeloid cells. All the data represent the mean ± SEM (n = 5); #P < 0.05 versus 0 Gy control; ∗P < 0.05 versus 4 Gy control.

