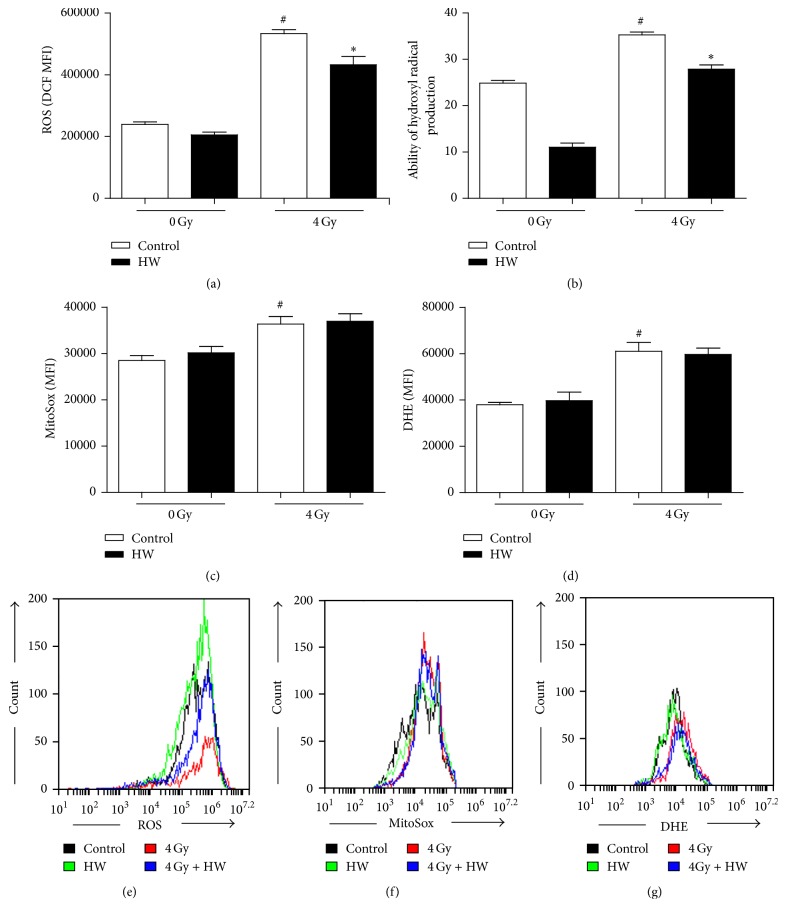
Figure 5.
HW decreases TBI-induced ROS production in c-kit+ cells. (a) The bar graph shows the levels of intracellular ROS, as detected by DCF mean fluorescence intensity (MFI). (b) The bar graph shows hydroxyl radical production, as detected by the Fenton reaction. (c) The bar graph shows the levels of intracellular ROS, as detected by DHE MFI. (d) The bar graph shows the intracellular ROS in mitochondria, as detected by the MitoSox MFI. (e–g) Representative FACS plots of the ROS levels detected by DCF, DHE, and MitoSox MFI. All the data represent the mean ± SEM (n = 5 in panels (a), (c), and (d); n = 3 in panel (b)); #P < 0.05 versus 0 Gy control; ∗P < 0.05 versus 4 Gy control.

