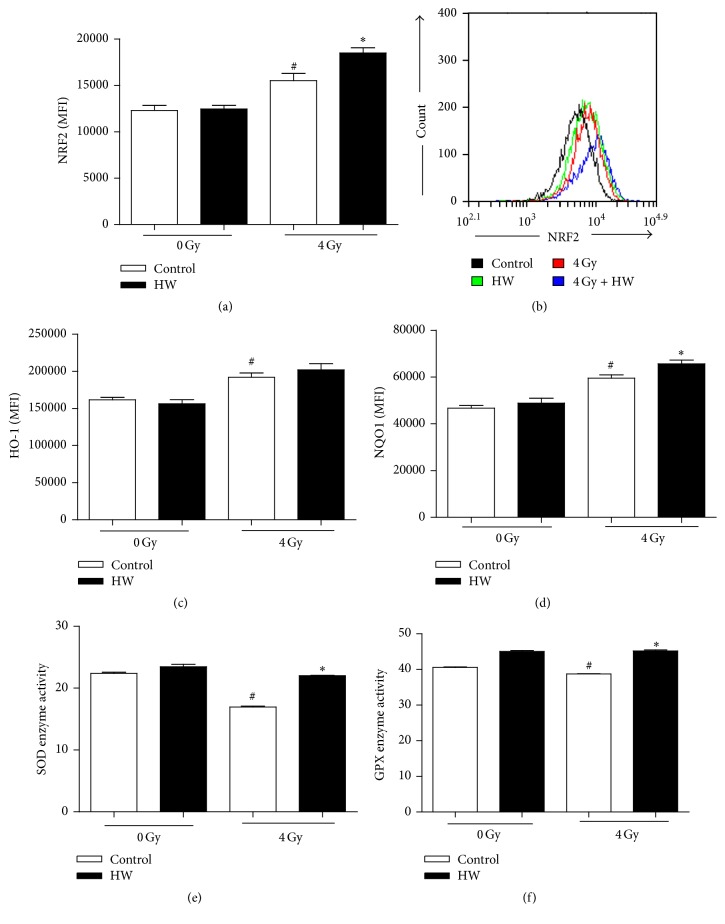
Figure 8.
HW upregulates expression of NRF2 targeted proteins and enzyme activity of SOD2 and GPX1 in mice c-kit+ cells 15 days after 4 Gy TBI. (a) Bar graphs show the protein level of NRF2 in c-kit+ cells, as detected by FACS. (b) Representative FACS plots of NRF2. (c-d) Bar graphs show the protein level HO-1 and NQO1 in c-kit+ cells, as detected by FACS. (e-f) Bar graphs show the total enzyme activities of SOD and GPX in c-kit+ cells. All the data represent the mean ± SEM (n = 5 in panels (a), (c), and (d) and n = 3 in panels (e)-(f)); #P < 0.05 versus 0 Gy control; ∗P < 0.05 versus 4 Gy control.

