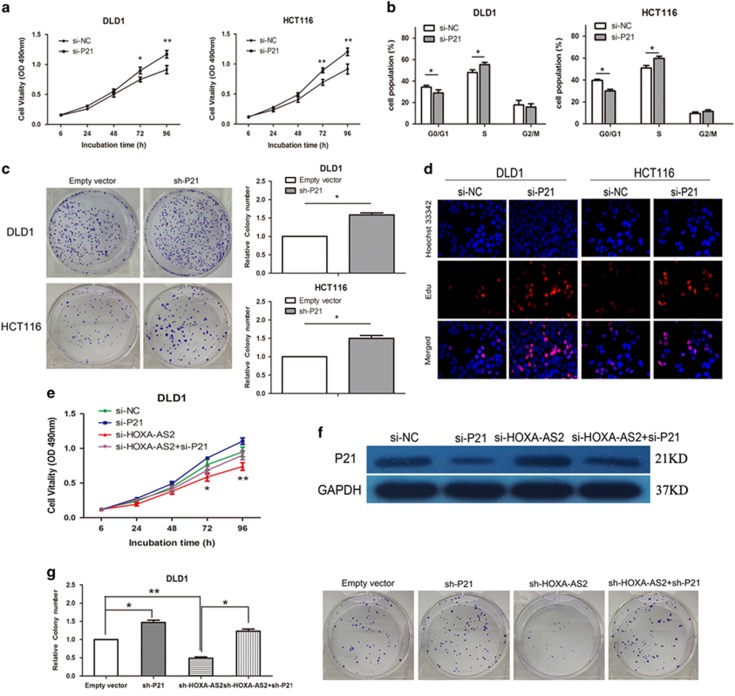
Figure 5.
Silencing p21 potentially involves the oncogenic function of HOXA-AS2. (a) An MTT assay was performed to determine DLD1 and HCT116 cell proliferation following treatment with si-p21 or si-NC. The data represent the means±s.d. from three independent experiments. (b) The bar chart represents the percentage of cells in G0/G1, S or G2/M phase, as indicated. (c) Colony-forming growth assays were performed to determine CRC cell proliferation. The colonies were counted and captured. (d) Proliferating CRC cells were labeled with Edu. The Click-it reaction revealed Edu staining (red). Cell nuclei were stained with Hoechst 33342 (blue). The images are representative of the results obtained. (e, g) MTT and colony-formation assays were used to determine the cell viability for si-HOXA-AS2 and si-p21 co-transfected DLD1 cells. (f) Western blot analysis of p21 after si-HOXA-AS2 and si-p21 co-transfection in DLD1 cells. GAPDH protein was used as an internal control. Experiments were performed in triplicate. Error bars indicate mean±s.e.m. *P<0.05 and **P<0.01. NC, negative control.

