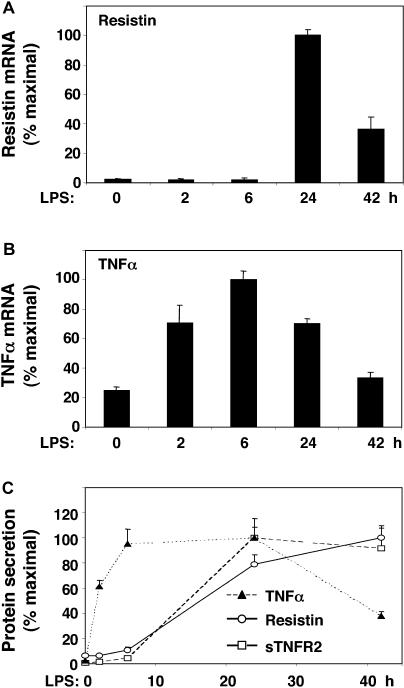
Figure 2. Endotoxin Induction of Resistin Occurs after Induction of TNFα.
Primary cultures of human macrophages were treated with LPS (1 μg/ml) for various times.
(A) Time course of induction of resistin mRNA. The ANOVA F statistic for the change in resistin mRNA over time was 105.45 (p < 0.001).
(B) Time course of induction of TNFα mRNA. The ANOVA F statistic was 34.57 (p < 0.001).
(C) Time course of secretion of resistin, TNFα, and sTNFR2 into medium. ANOVA F statistics for the effect of LPS on resistin (66.51, p < 0.001), sTNFR2 (12.86, p < 0.001), and TNFα (20.48, p < 0.001) were highly significant. Maximal secreted protein levels were as follows: resistin, 21.9 ng/ml/mg; TNFα, 207.2 ng/ml/mg; and sTNFR2, 39.3 ng/ml/mg. Results of representative experiments with triplicate samples are expressed as mean (± SEM). Similar results were obtained in three independent experiments.

