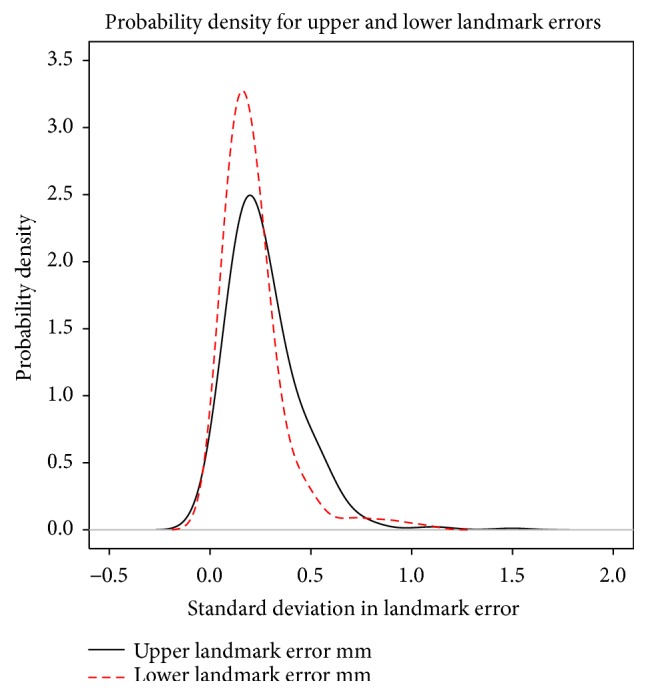
Figure 3.

Probability density plot of errors of rigid body fitting describing the relative likelihood for the distance between individual RSA and CT derived landmarks to take on a given value after rigid body fitting. The probability of the distance falling within a particular range of values is given by the area under the density function.
