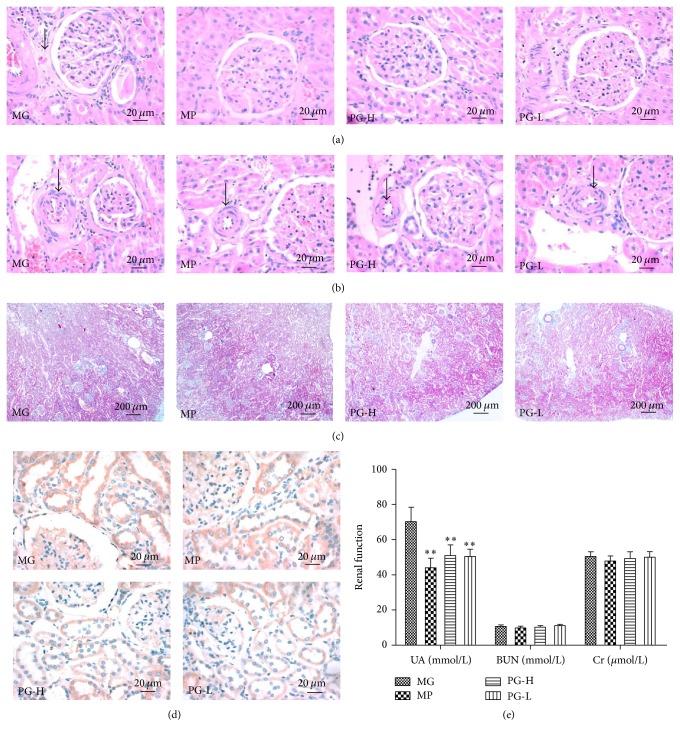
Figure 10.
Effect on histopathology of kidney and renal function after being intervened by paeoniflorin enriched extract (PG). (a) Representative photomicrograph of histopathologic observation for glomerulus by hematoxylin-and-eosin staining (H&E) (×400). (b) Representative photomicrograph of histopathologic observation for glomerular afferent arteries by H&E (×400). (c) Representative photomicrograph of histopathologic observation for kidney by Masson's trichrome staining (×40). (d) Representative photomicrograph of the COX-2 expression in kidney by immunohistochemistry (IHC) (×400). (e) The renal function indexes of serum UA, BUN, and Cr. MG: model group; MP: metoprolol positive group; PG-H: PG high dose group (90 mg/kg); PG-L: PG low dose group (30 mg/kg). Data were mean ± SD (n = 8). ∗∗P < 0.01 versus MG.

