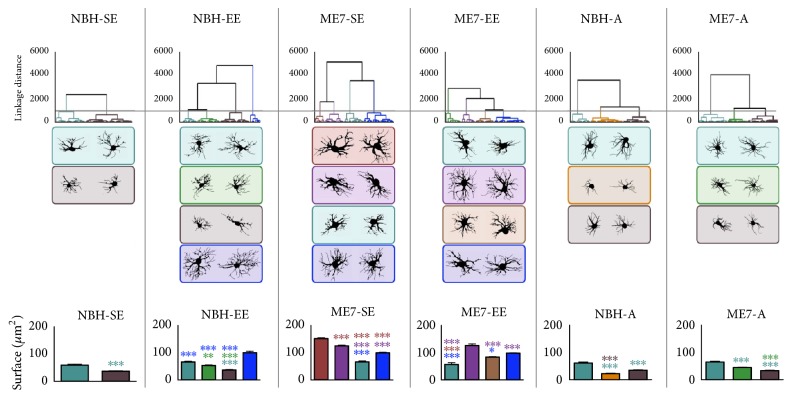
Figure 11.
Hierarchical cluster analysis of morphological features of astrocytes from the polymorphic layer limited to each experimental group. Astrocytes associated with SE exhibited only two morphological families, whereas those from EE animals showed four distinct morphological families. Astrocytes from ME7 groups were distributed into four different families with a larger surface area, and two of these astrocyte families exhibited significantly higher values for branch surface areas than all NBH families. Aged groups showed three astrocyte families. NBH-A formed a family with smaller surface area, suggesting that SE and aging, acting together, shrank astrocytes trees. In contrast, prion disease increased it. Branch surfaces (from all groups), soma area (from ME7 groups), and branch length (from EE and NBH-A groups) were the morphometric features that most contributed to cluster formation. (∗p < 0.05; ∗∗p < 0.01; ∗∗∗p < 0.001, Bonferroni posttests).

