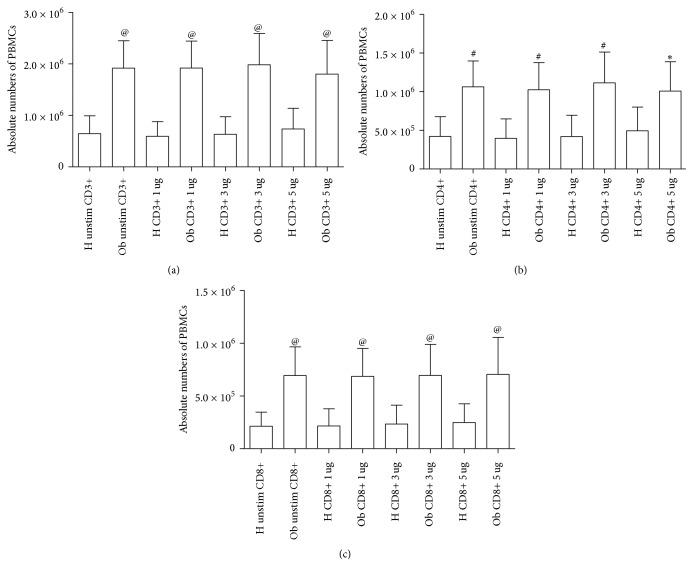
Figure 1.
Absolute numbers of PBMCs from H and Ob individuals. (a) Absolute numbers of CD3+ cells from untreated and treated cells with 1, 3, and 5 μg polyphenols, respectively. (b) Absolute numbers of CD4+ cells from unstimulated and treated cells with 1, 3, and 5 μg dose polyphenols, respectively. (c) Absolute numbers of CD8+ cells from untreated and treated cells with 1, 3, and 5 μg dose polyphenols, respectively. H = healthy donors, Ob = obese people. Statistical analysis was performed using the GraphPad Prism statistical software release 5.0 for Windows Vista. Bonferroni's test was used for comparison between the H and Ob samples. Statistical significance was set at p < 0.05. (a) @p < 0.0001 H unstimulated versus Ob unstimulated, @p < 0.0001 H 1 μg/ml versus Ob 1 μg/ml, @p < 0.0001 H 3 μg/ml versus Ob 3 μg/ml; @p < 0.0001 H 5 μg/ml versus Ob 5 μg/ml: (b) #p < 0.001 H unstimulated versus Ob unstimulated, #p < 0.001 H 1 μg/ml versus Ob 1 μg/ml, #p < 0.001 H 3 μg/ml versus Ob 3 μg/ml, ∗p < 0.05 H 5 μg/ml versus Ob 5 μg/ml; (c) @p < 0.0001 H unstimulated versus Ob unstimulated, @p < 0.0001 H 1 μg/ml versus Ob 1 μg/ml, @p < 0.0001 H 3 μg/ml versus Ob 3 μg/ml, @p < 0.0001 H 5 μg/ml versus Ob 5 μg/ml.

