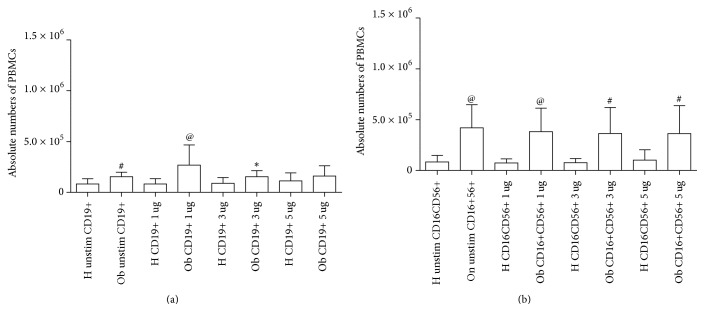
Figure 2.
Absolute numbers of PBMCs in H and Ob individuals. (a) Absolute numbers of CD19+ cells from untreated and treated cells with 1, 3, and 5 μg dose polyphenols, respectively. (b) Absolute numbers of CD16+CD56+ cells from untreated and treated cells with 1, 3, and 5 μg dose polyphenols, respectively. For abbreviations and statistical analysis, see Figure 1. (a) #p < 0.001 H unstimulated versus Ob unstimulated, @p < 0.0001 H 1 μg/ml versus Ob 1 μg/ml, ∗p < 0.05 H 3 μg/ml versus Ob 3 μg/ml (b) @p < 0.0001 H unstimulated versus Ob unstimulated, @p < 0.0001 H 1 μg/ml versus Ob 1 μg/ml, #p < 0.001 H 3 μg/ml versus Ob 3 μg/ml, #p < 0.001 H 5 μg/ml versus Ob 5 μg/ml.

