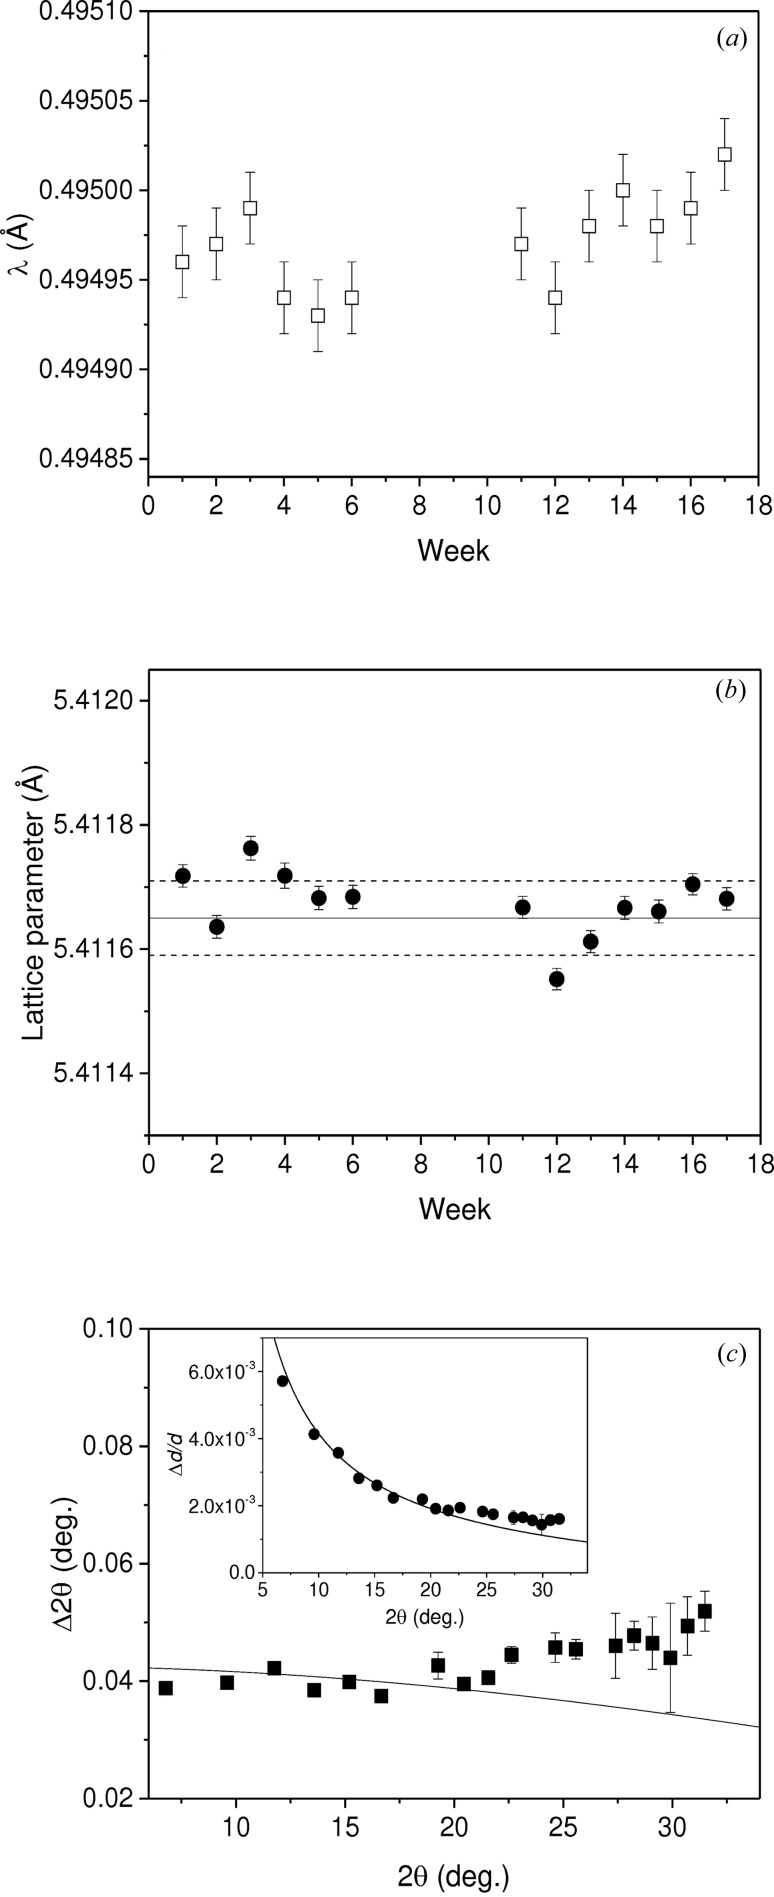
Figure 7.
(a) Refined wavelength (λ) as a function of duration obtained from weekly measured CeO2 patterns after adjusting the monochromator to 25 keV each week. The absence of data between 7 and 10 weeks was due to a synchrotron machine shutdown. (b) The cubic unit-cell parameter as a function of duration, showing good reproducibility; the horizontal solid line is the certified value [a 0 = 5.41165 (6) Å] and the dashed lines are the lower and upper limits of the error. (c) The instrumental resolution function represented by Δ2θ (main plot) and Δd/d (inset) as a function of 2θ. The data were obtained from an LaB6 pattern (D = 400 mm, beam size = 200 × 200 µm and 25 keV beam).

