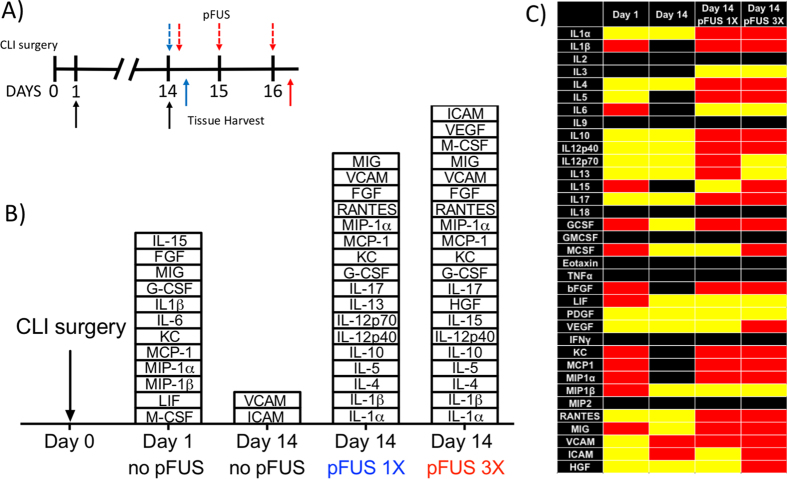
Figure 2. Proteomic responses to critical limb ischemia (CLI) alone and pulsed focused ultrasound (pFUS) in CLI skeletal muscle.
(A) Experimental timeline showing CLI at Day 0. pFUS treatment time points (Days 14, 15, and 16) are indicated by dashed arrows on top of timeline and tissue harvest time points (Days 1, 14, and 16) are indicated by solid arrows on the bottom of timeline. (B) Stack box plot showing significant (p < 0.05; n = 6 mice per group per time point) elevations of cytokines, chemokines, trophic factors, and cell adhesion molecules compared to normal muscle after CLI alone (Days 1 and 14), after 1 course of pFUS (day 14 pFUS 1x), and after 3 daily courses of pFUS (day 14 pFUS 3x). Comparisons were made using one-way ANOVA with Bonferroni corrections; n = 6 mice/time point. (C) Heat map depicting significant differences shown in (B). Red indicates significant elevations, yellow represents no change, and black indicates undetectable protein levels. (see Supplemental Figure 1 for primary data and Supplemental Table 1 for abbreviations).

