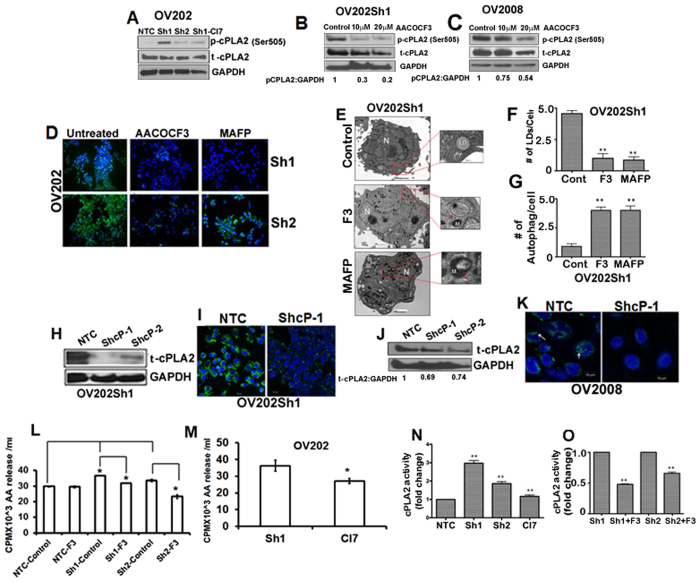
Figure 2. Inhibition of cPLA2 attenuates lipid droplet biogenesis in OV202Sh1 cells.
(A) Immunoblot analysis shows p-cPLA2 and t-cPLA2 levels in OV202 NTC, Sh1, Sh2 and Cl7 cells. (B and C) Immunoblot analysis shows p-cPLA2 and total-cPLA2 levels in OV202 Sh1 and OV2008 cells after treatment with 10 μM and 20 μM of cPLA2 inhibitor and AACOCF3, respectively. (D) Sh1 and Sh2 cells were treated with either 10μM of AACOCF3 or 10μM of MAFP for 24 hours followed by Bodipy (493/503) staining to identify lipid droplets (LD). (E) Representative trans-electron microscopic (TEM) images of OV202 Sh1 cells untreated and treated with 10 μM of AACOCF3 (F3) and 10 μM of MAFP for 24 hours. LDs are marked with green arrows, whereas red arrows indicate autophagic vesicles (AV). (F and G) Quantification of LDs and AVs from the TEM images presented in a bar graph.(H and J). Total cPLA2 expression was transiently downregulated with two different ShRNAs targeting the open reading frame of cPLA2 in OV202Sh1 and OV2008 cells. Immunoblot analysis shows total-cPLA2 expression in NTC, ShcP-1 and ShcP-2 cells. (I and K) Bodipy staining of LDs in OV202 Sh1 and OV2008 cells after transiently transfecting them with either empty vector or Sh-cPLA2. (L) Arachidonic acid (AA) release is evaluated in OV202 NTC, Sh1, and Sh2 cells treated or untreated with 10 μM of AACOCF3 (F3). Cells were incubated with H3-AA under serum starved condition for 24 hours. Fresh medium was added to the cells after washing and aliquots of growth medium were measured for radioactivity after 24 hours. Radioactivity is presented as counts per minute (cpm)/ml. (M) AA release was evaluated in OV202 Sh1 and Cl7 cells. (N) cPLA2 enzyme activity was measured in OV202 NTC, Sh1, Sh2 and Cl7 cells using the cPLA2 activity assay kit. (O) cPLA2 activity was also determined in OV202 Sh1 and Sh2 cells after treating them with AACOCF3. AA release and cPLA2 activity assay experiments were repeated three times. Data are shown as mean ± SD of 3 replicates per treatment. *P < 0.05; **P < 0.01. Band intensity was quantified using Image J software.

