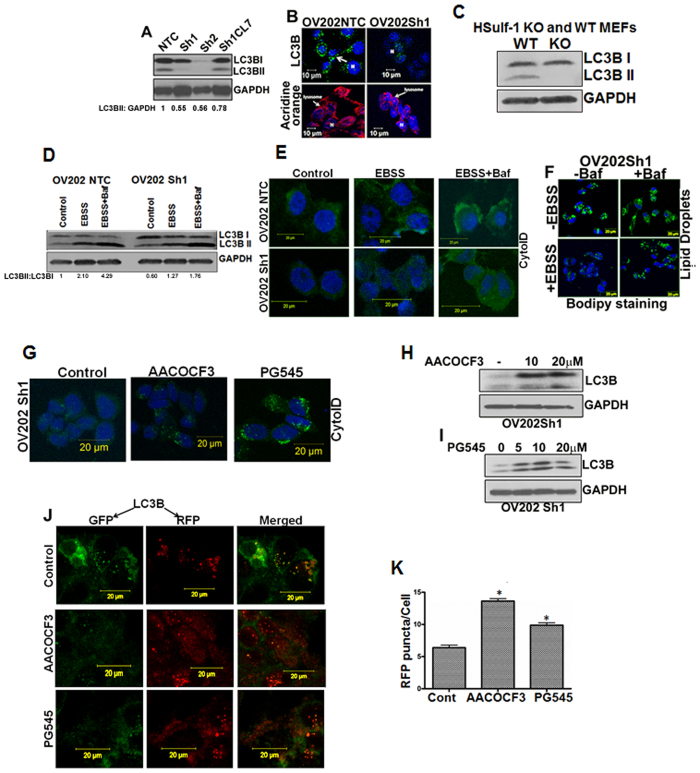
Figure 4. Dysfunctional autophagy is associated with loss of HSulf-1 and activation of cPLA2.
(A) Immunoblot analysis with anti-LC3B antibody in OV202 NTC, Sh1, Sh2 and Cl7 cells. (B) Immunoflourescence analysis of OV202 NTC and Sh1 cells with anti-LC3B antibody (green, top panels), acridine orange (red, lower panels) and DAPI (blue). (C) Immunoblot analysis of LC3BI and LC3BII in HSulf-1 knockout Mouse Embryonic Fibroblast (MEF) and wild type cells were performed. GAPDH was used as a loading control. (D) Immunoblot analysis of LC3Bin OV202 NTC and Sh1 cells treated with EBSS with or without bafilomycin A1 (100 nM) for 2 hours. GAPDH was used as a loading control. LC3BII to GAPDH ratio is also presented in this figure. (E) Cyto-ID staining of OV202 NTC and Sh1 cells in control, EBSS and EBSS + Baf treated cells. Cells were grown in either regular media or EBSS to induce autophagy. (F) Bodipy staining of lipid droplets (LD) in OV202 Sh1 cells treated with EBSS with or without bafilomycin A1 (100 nM) for 1 hour. Cells grown in complete medium were used as controls (without EBSS). (G) Immunofluorescence analysis of Cyto-ID staining of OV202 Sh1 cells treated with 20 μM of AACOCF3 and 20 μM of PG545 showing increase in autophagy. (H and I) Immunoblot analysis of LC3BII levels in OV202 Sh1 cells treated with increasing concentrations of AACOCF3 and PG545, respectively. (J) Following transient expression of Cherry-GFP-LC3B (48 hours of incubation), autophagic flux was assessed in OV202 Sh1 cells treated with AACOCF3 and PG545 for 24 hours. Confocal microscopy analysis showed changes in the autolysosome formation. Representative images from two independent experiments are shown. (K) Quantification of RFP puncta is presented in a bar diagram. 25 cells were quantified for fluorescence measurement. Data are shown as mean ± SD for 3 replicates per treatment. *P < 0.05.

