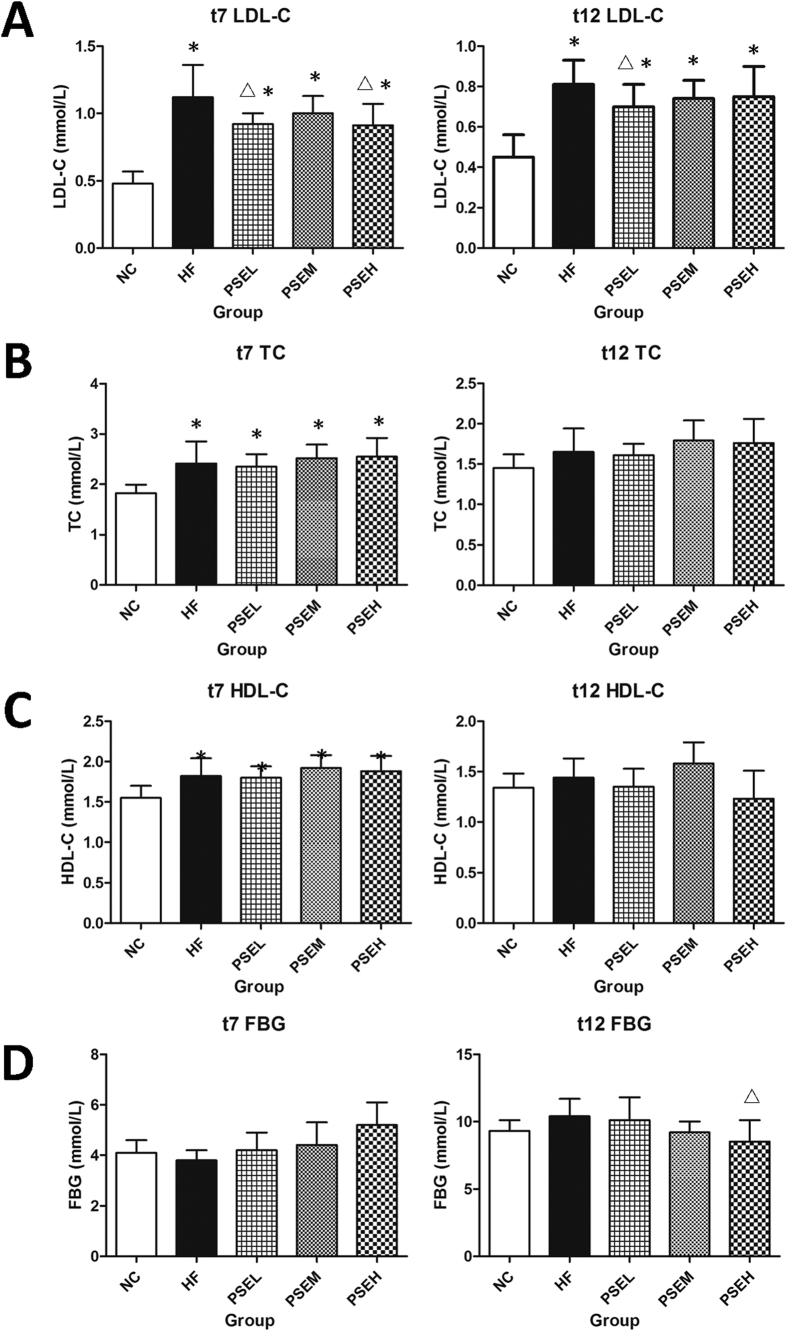
Figure 1. Effects of PSEs on serum lipid and glucose levels in rats at t7 and t12.
(A) LDL-C; (B) TC; (C) HDL-C; and (D) FBG. NC: Normal control group (n = 6); HF: high-fat diet group (n = 12); PSEL: low-dose PSEs treatment group (0.05 g/100 g·BW, n = 12); PSEM: medium-dose PSEs treatment group (0.10 g/100 g·BW, n = 12); and PSEH: high-dose PSEs treatment group (0.15 g/100 g·BW, n = 12). t7 and t12 indicate data measured at the 7th week of the experiment and at the end of the experiment, respectively. The data are expressed as the mean ± standard deviation. *P < 0.05 vs. NC group; ΔP < 0.05 vs. HF group.

