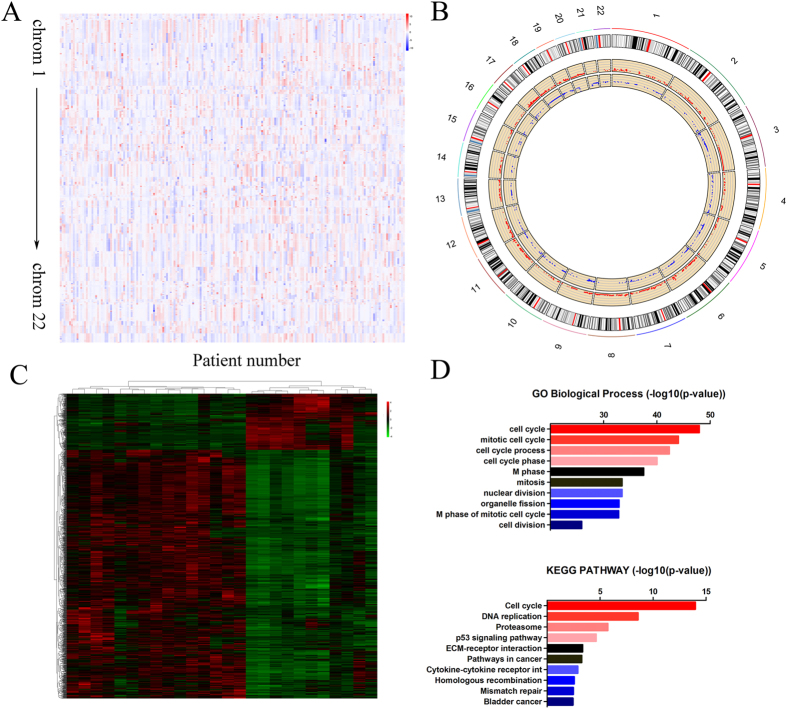
Figure 2. Systematic analysis of copy number alterations and differentially transcribed genes.
(A) Copy number segment across esophageal carcinoma patients from TCGA. (B) CNTools and cghMCR packages of R software were used to identify regions related to copy number variant. The red region indicates amplification, while the blue region indicates deletion. (C) The heatmap reveals the significantly differentially expressed genes between tumor and normal samples. (D) Bioinformatic analysis of genes differentially expressed according to Gene Ontology and KEGG pathway.

