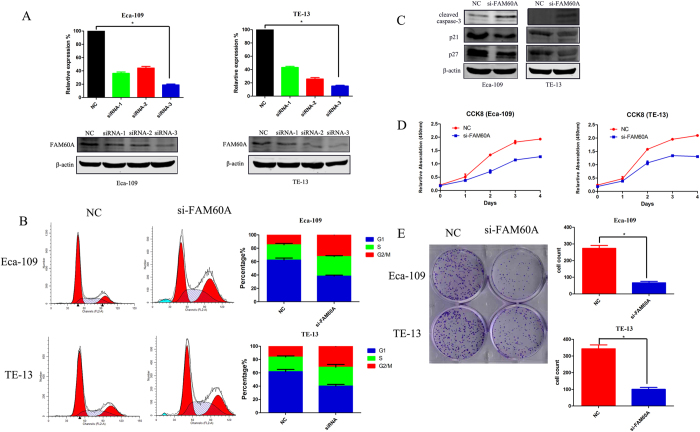
Figure 5. Knockdown of FAM60A expression in esophageal carcinoma cell lines.
(A) Reductions in mRNA and protein levels of FAM60A 48 h after siRNA transfection in Eca-109 and TE-13 cells. (B) Cell cycle assay revealed that FAM60A inactivation decreased the percentage of G1 phase cells and arrested cells at G2/M phase. (C) Western blotting was utilized to detected the protein levels of cleaved caspase-3, p21 and p27 when the expression of FAM60A was suppressed. (D) CCK8 assay suggested that FAM60A promoted cell growth in vitro. (E) Clonogenic survival assay indicated that suppression of FAM60A inhibited the formation of clonogenic clusters. The data are presented as the mean ± SD. *Indicates statistical significance versus the control group (p < 0.05).

