
Figure 3. Ethanol concentration in anaerobic respiration process.
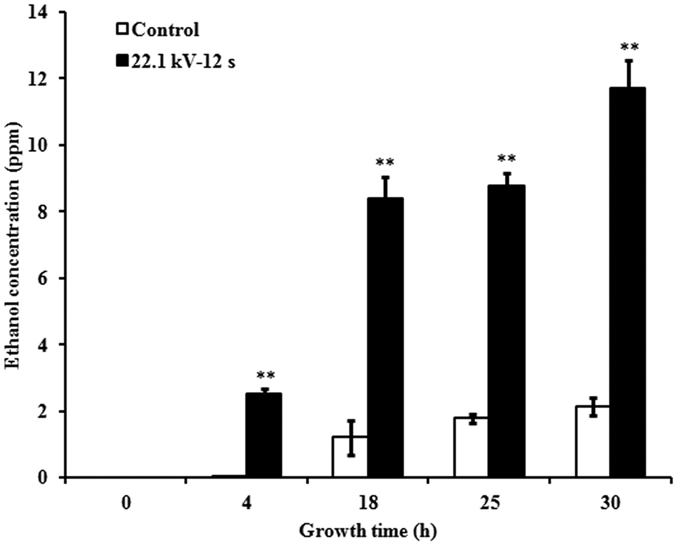
Ethanol concentration was measured after 0, 4, 18, 25, and 30 h air proof using a gas chromatograph. Error bars indicated standard error (n = 3). *p < 0.05 versus control; **p < 0.01 versus control, according to LSD test.