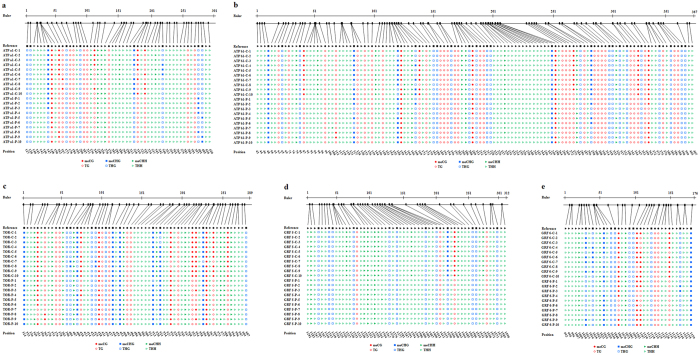
Figure 5.
Cytosine methylation analysis results of (a) ATP a1, (b) ATP b1, (c) TOR, (d) GRF 5, and (e) GRF 6 of 6-day-old soybean sprouts were analyzed using CyMATE. The length of sequenced region and position of cytosine are shown schematically. The order of the individual sequences of ten clones is listed on the left. C represents the control group, P represents plasma-treated group at 22.1 kV for 12 s. Reference sequence is shown in the first line. The sequence is distinguished by circles for CG, squares for CHG, and triangles for CHH. Filled symbols represent methylated cytosine, open symbols represent unmethylated cytosine.

