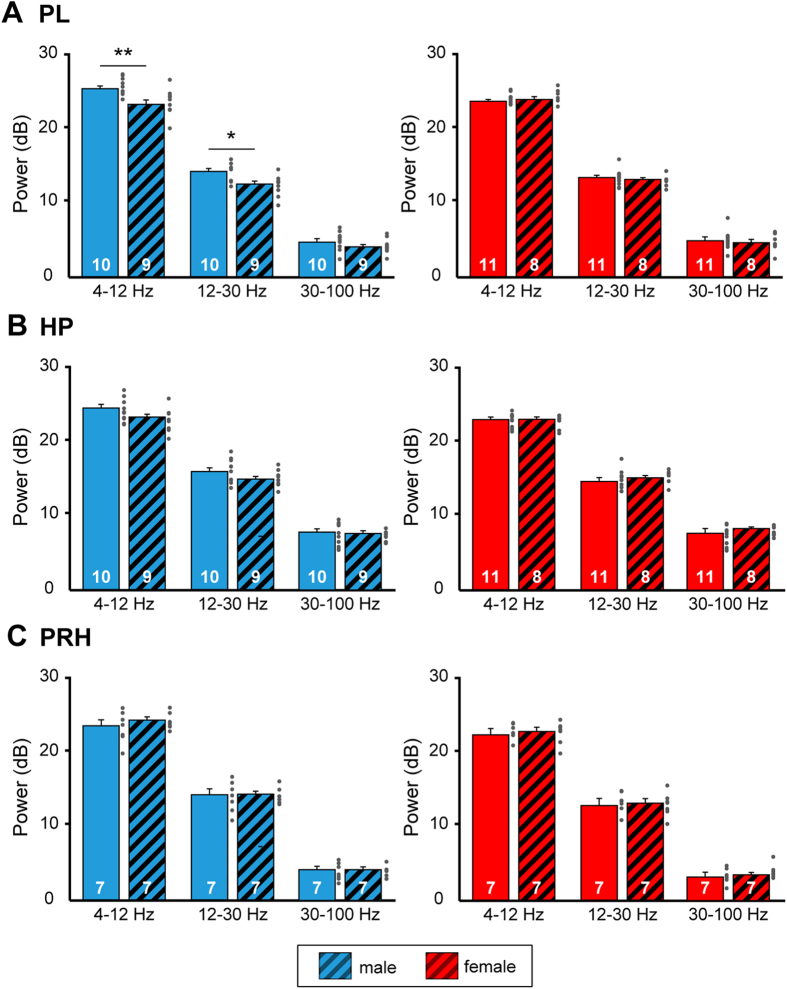
Figure 4. Consequences of maternal deprivation on juvenile network activity.
(A) Bar diagram displaying the mean power of oscillatory activity in theta, beta and gamma band recorded from the PL of male (blue) and female (red) CON and ELS rats. (B) Same as (A) for oscillatory activity in HP. (C) Same as (B) for oscillatory activity in PRH. Data are displayed as mean ± SEM. Grey dots correspond to individual values and the number of investigated animals is marked on each bar. (*)p < 0.05 and (**)p < 0.01.

