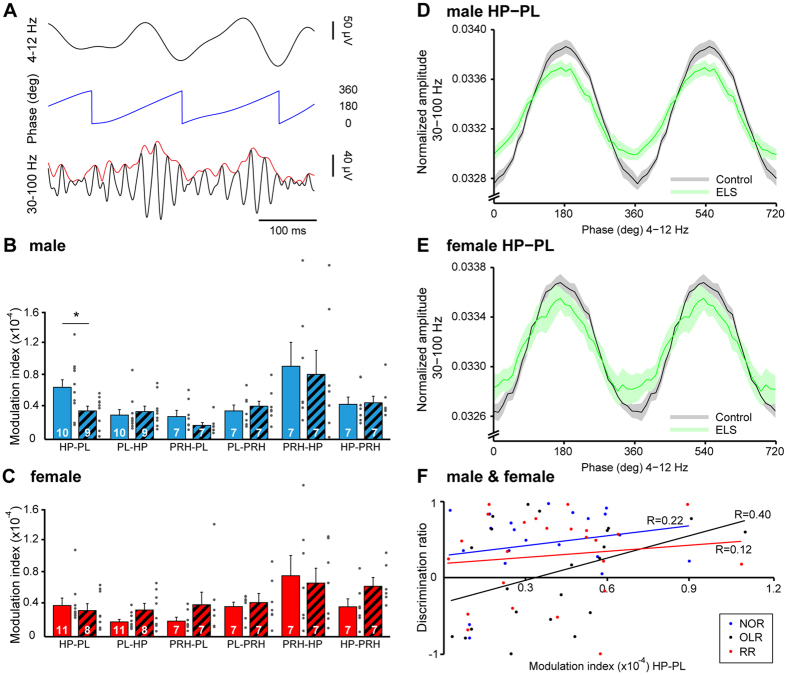
Figure 6. Consequences of maternal separation on theta-gamma cross-frequency-coupling (CFC) within prelimbic-hippocampal-perirhinal networks.
(A) Schematic diagram of the parameters necessary for CFC calculation: phase (blue, middle) of theta oscillations (top) and amplitude (red, bottom) of simultaneously recorded gamma oscillations. (B) Bar diagram displaying the CFC modulation indices calculated for pairs of regions in male CON (blue solid) and ELS rats (blues dashed). The theta phase corresponds to the firstly named region and the gamma-amplitude to the secondly named one. (C) Same as (B) for female CON and ELS rats. (D) Line plot displaying the phase-amplitude coupling of hippocampal theta phase and prelimbic gamma amplitude averaged for male CON (black) and ELS (green). The transparent area corresponds to SEM. (E) Same as (D) for female CON and ELS. (F) Scatter plot displaying the relationship between the hippocampal-prelimbic CFC and the behavioral performance in NOR, OLR and RR. The regression lines are displayed in the corresponding color (blue for NOR, black for OLR and red for RR) and the regression coefficients (R) are indicated. For bar diagrams, data are displayed as mean ± SEM. Grey dots correspond to individual values and the number of investigated animals is marked on each bar. (*)p < 0.05.

