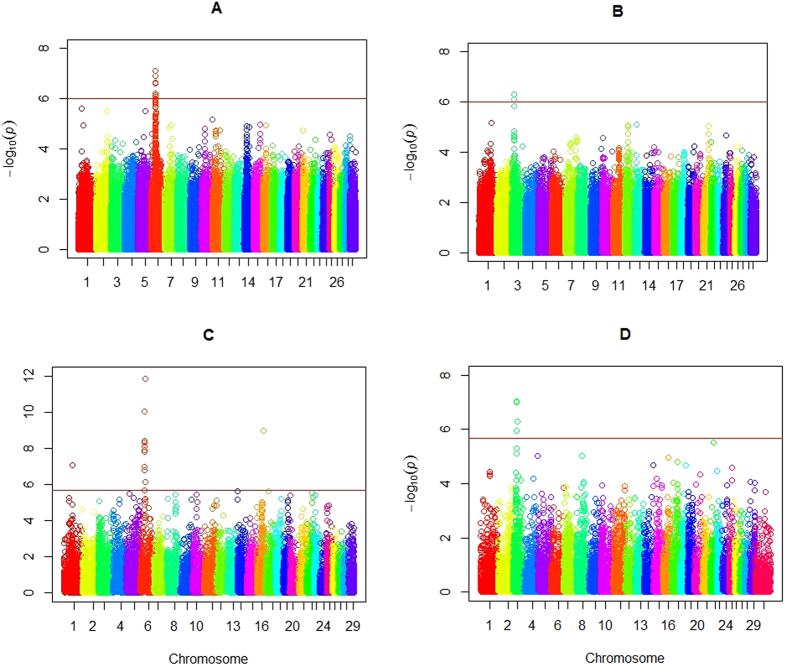
Figure 2. Manhattan plots of −log10(p values) for two traits from the single-SNP method and the gene-based method.
Panels A and B are the plots for bone weight and pH values, respectively, in the single-marker analysis. Panels C and D are the plots for bone weight and pH values, respectively, in the gene-based association analysis. The 29 chromosomes are color coded. The red horizontal line indicates genome-wide significance level from Bonferroni correction (−log10(1/677855)) for the single-marker analysis. The genome-wide significance level for the gene-based method is (−log10 (0.05/21836)).

