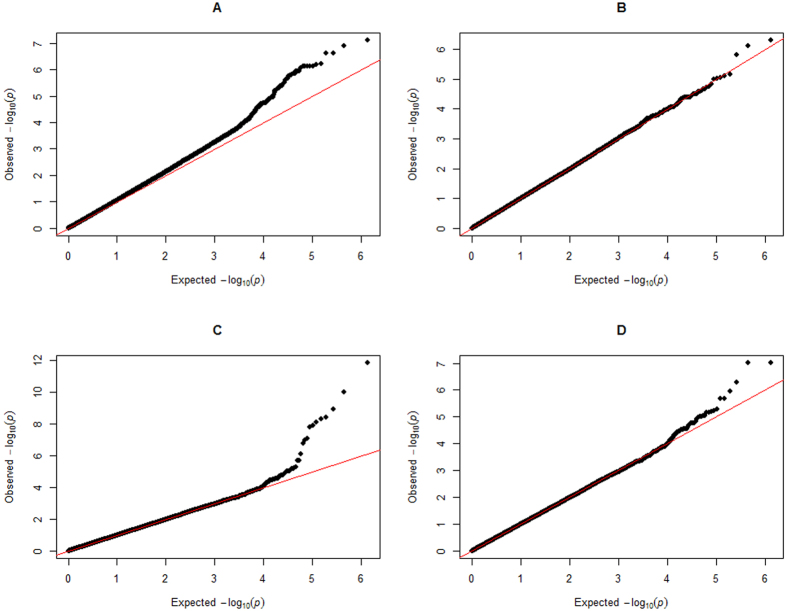
Figure 3. The Quantile-Quantile plot of p-values.
The observed negative logarithms of the p values in GWAS using the gene-based method and the single-marker method for two traits are plotted against their expected values under the null hypothesis of no association with the trait. Panels A and B show the plots for bone weight and pH value, respectively, in the single-marker analysis. Panels C and D show the plots for bone weight and pH value, respectively, in the gene-based association analysis.

