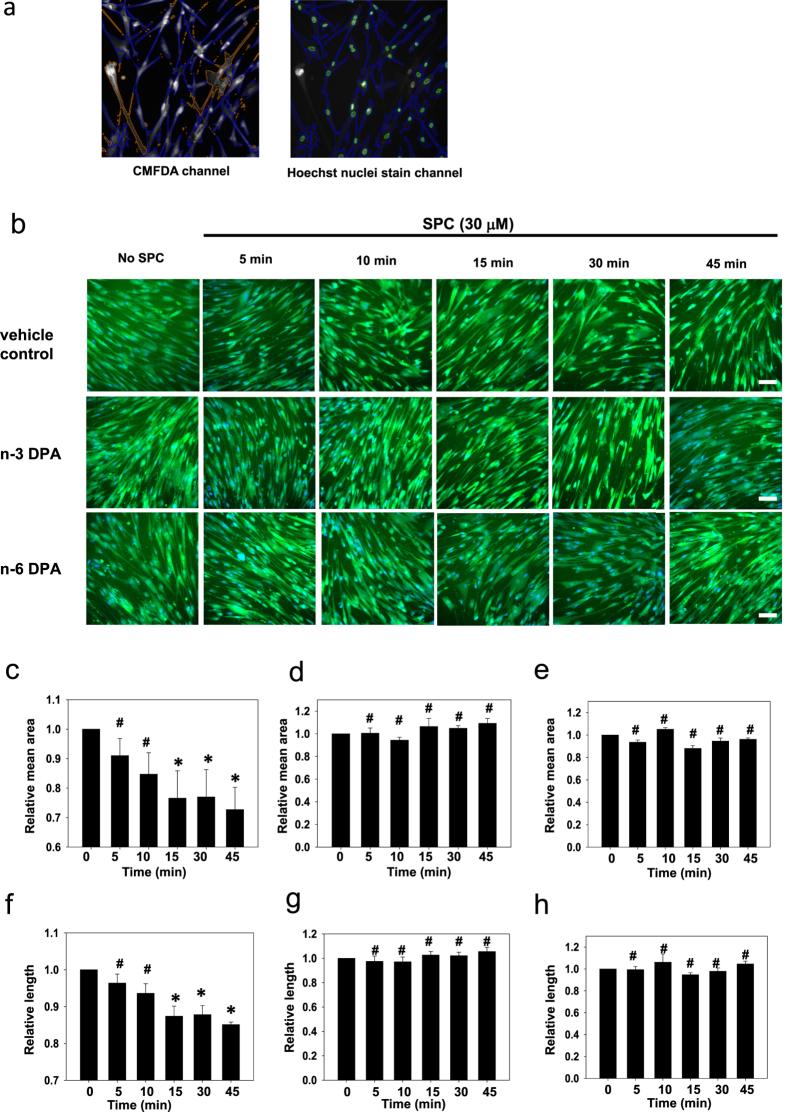
Figure 5. Effects of n-3 and n-6 DPA on SPC-induced contraction in CASMCs visualized by ArrayScan.
(a) Definition of the area and number of cells with ArrayScan™ Software. The blue lines represent an individual cell based on CMFDA cytoplasmic staining (left and right images), and green lines represent cell nuclei based on Hoechst nuclear staining (right image) according to the settings of the Bioapplication (Thermo Fisher Scientific) algorithm. (b) Representative images of wells with vehicle control pretreatment, n-3 DPA pretreatment (60 μM for 30 min), and n-6 DPA pretreatment (60 μM for 30 min) after stimulation with SPC for different lengths of time. Scale bar = 20 μm. Statistical analysis of SPC-stimulation-induced changes in the cell area of the vehicle control group (c) n-3 DPA pretreated group (d) and n-6 DPA pretreated group (e) after different times of SPC stimulation. Statistical analysis of SPC-stimulation-induced changes in the cell length of the vehicle control group (f) n-3 DPA pretreated group (g) and n-6 DPA pretreated group (h) after different times of SPC stimulation. Data are expressed as the mean±SE. *P < 0.01 versus 0 min, #P > 0.05 versus 0 min.

