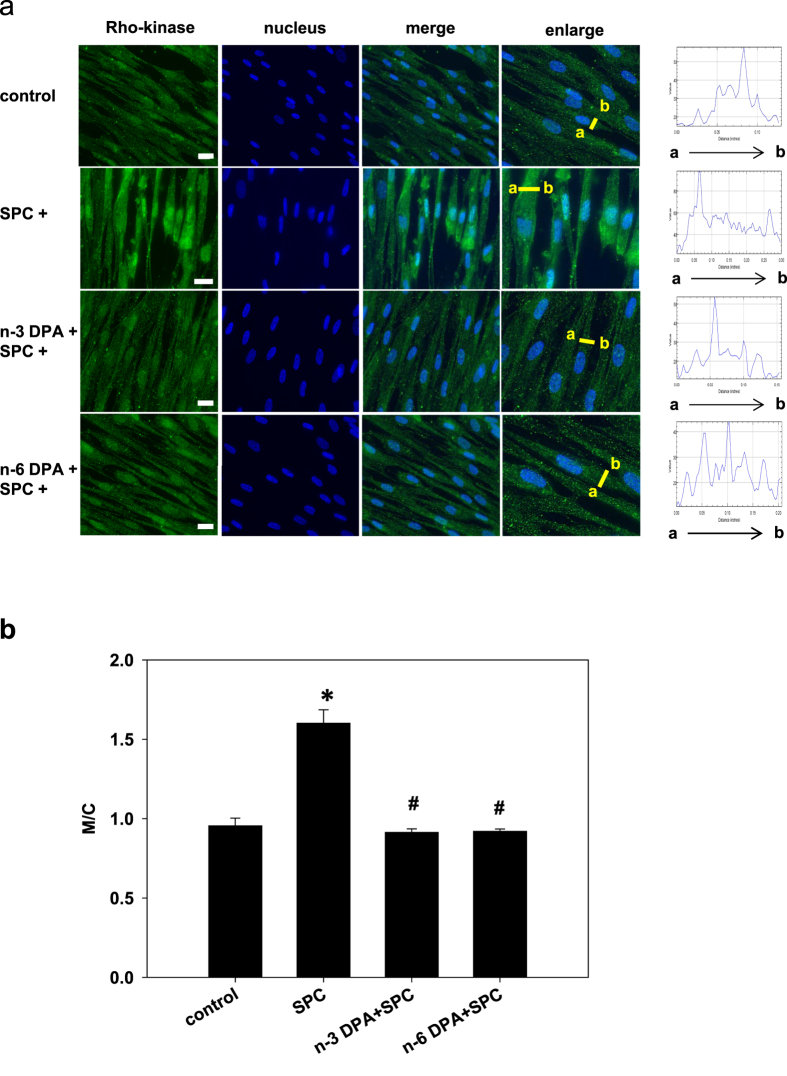
Figure 6. The inhibitory effects of n-3 and n-6 DPA on SPC-induced Rho-kinase translocation.
(a) Representative images of cells pretreated with n-3 or n-6 DPA (60 μM) or vehicle control for 30 min, stimulated with SPC for 15 min, fixed, permeabilized, and stained with anti-Rho-kinase 2 antibody (green) and Hoechst nuclear stain (blue). Arrow (a → b) indicates that the change of Rho-kinase intensity from the membrane to cytosol. Scale bar = 20 μm. (b) Statistical analysis of changes in the ratio of Rho-kinase membrane (M) to cytosol (C) signaling M/C denotes the ratio of the intensity in membrane to cytosol signaling. Data are expressed as the mean±SE. n ≧ 10. *P < 0.01 versus vehicle control group; #P < 0.01 versus SPC-treated group.

