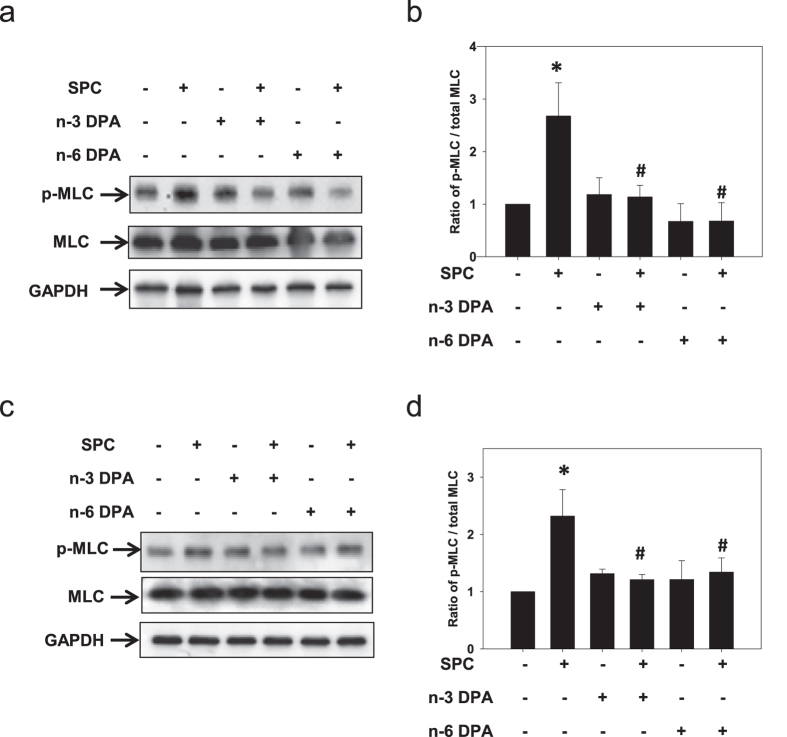
Figure 8. The inhibitory effects of n-3 and n-6 DPA on SPC-induced phosphorylation of MLC.
(a,c) Representative western blots using anti-phospho-myosin light chain (anti-p-MLC) and anti-MLC antibodies with VSM tissue samples (a) and cells (c). (b,d) Statistical evaluation of the effects of n-3 and n-6 DPA (60 μM, 30 min pretreatment) on the level of p-MLC, which was expressed as a proportion of p-MLC to total MLC and designated as 100% in vehicle control group. *P < 0.01 versus vehicle control group; #P < 0.01 versus SPC-treated group (n = 4).

