Figure 8.
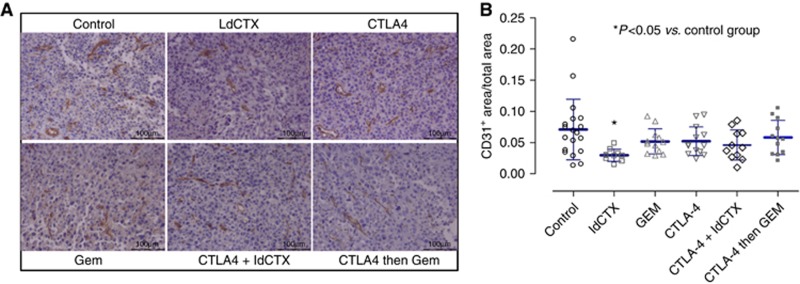
Analysis of CD31-positive staining in EMT-6 tumour treated with anti-CTLA-4 therapies. (A)EMT-6/P tumours were implanted s.c. into female Balb/c mice. Tumour bearing mice were treated with (i.e. a repeat of the experiment shown in Figure 2) saline control, CTLA-4, metronomic CTX (ld CTX), gemcitabine (Gem), or CTLA-4 plus ld CTX, or CTLA-4 with sequential Gemcitabine. The experiment was terminated as the tumours were starting to respond to the different therapies, as assessed by caliper measurements. Tumours were resected, fixed, and then paraffin embedded, and 5μ sections were then stained (brown) for CD31 (black bar=100 μ). (B) Image analysis of × 20 pictures of CD31 immunohistochemistry of tumour tissues from control- and drug-treated groups of mice. The quantification of the images was performed by the image analysis software ImageJ (Image Processing and Analysis in Java; Wayne Rasband, Research Services Branch, National Institute of Mental Health, Bethesda, MD, USA) and the results are shown as the ratio between the CD31-positive area and the total area of the image. A one-way ANOVA analysis followed by Bartlett's post test was applied to the results to demonstrate significant differences among the treatment groups. The statistical analysis of the data was performed with GraphPad Prism v.5.0. Blue lines, mean±s.d.; *P<0.05 vs control group.

