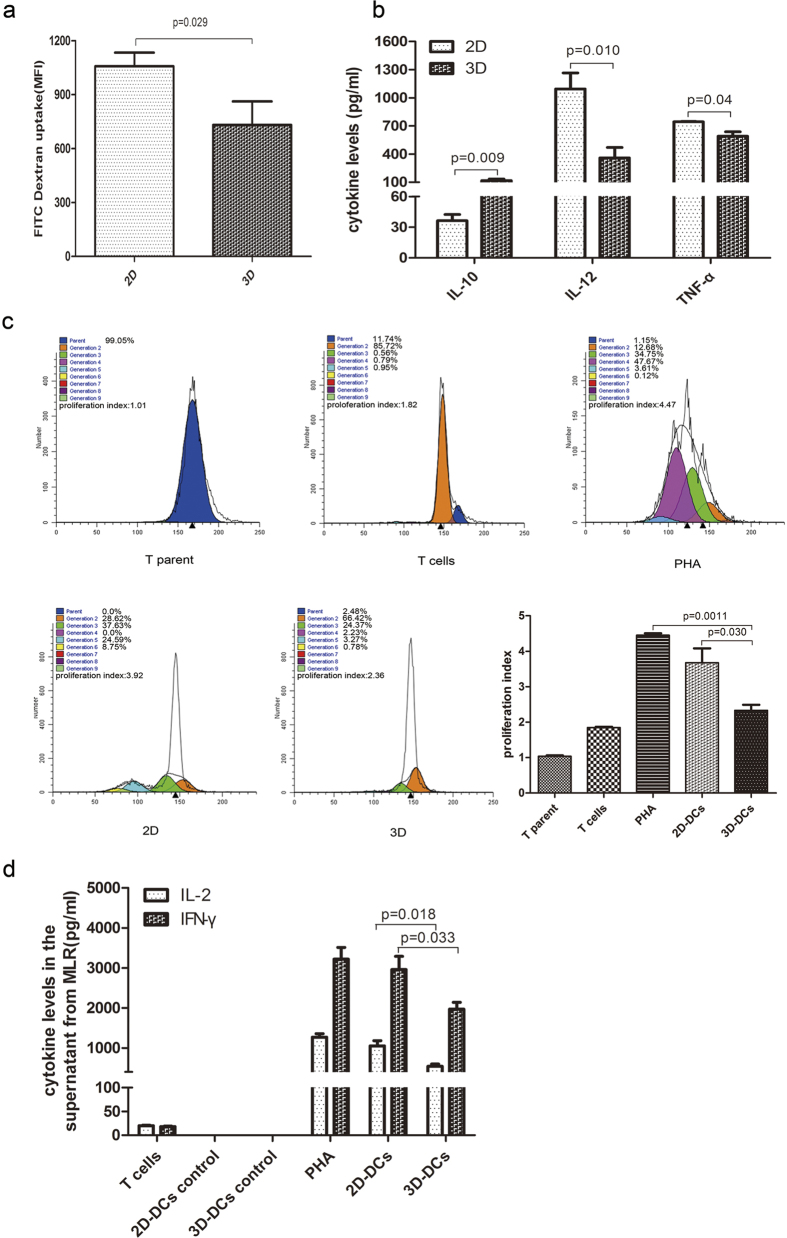
Figure 3. In vitro biological functional analysis of cultured DCs.
(a) Dextran-FITC uptake analysis of iDCs-2D and iDCs-3D. Data are representative of three independent experiments (mean ± SD). *P < 0.05 versus iDCs-2D. (b) Cytokine profile analysis of the cell supernatant of mDCs-2D and mDCs-3D. Data are shown as the mean ± SD of three independent experiments. *P < 0.05, **P < 0.01 versus 2D. (c) CD4+ T cell proliferation analysis of cultured DCs. CD4+ T cells from BALB/c mice were labelled with CFSE and co-cultured with cells from C57BL/6 mice from 2D (mDCs-2D) and 3D (mDCs-3D) culture or with T cells that were not stimulated or stimulated with phytohaemagglutinin (PHA) for 4 days. The cells were then harvested and analysed by FACS using ModiFit software. Different colours denote cellular generations. The numbers represent the percentage of different generations among the total cell population. The proliferation index represents the proportion of proliferating cells based on the difference between control and responder cells. Data are representative of three independent experiments (mean ± SD). *P < 0.05 versus mDCs-2D, **P < 0.01 versus PHA. (d) Quantification of IL-2 and IFN-γ produced by activated T cells from MLR. Data are shown as the mean ± SD of three independent experiments. *P < 0.05 versus mDCs-2D.

