
Figure 4. In vivo biological functional analysis of differentiated DCs.
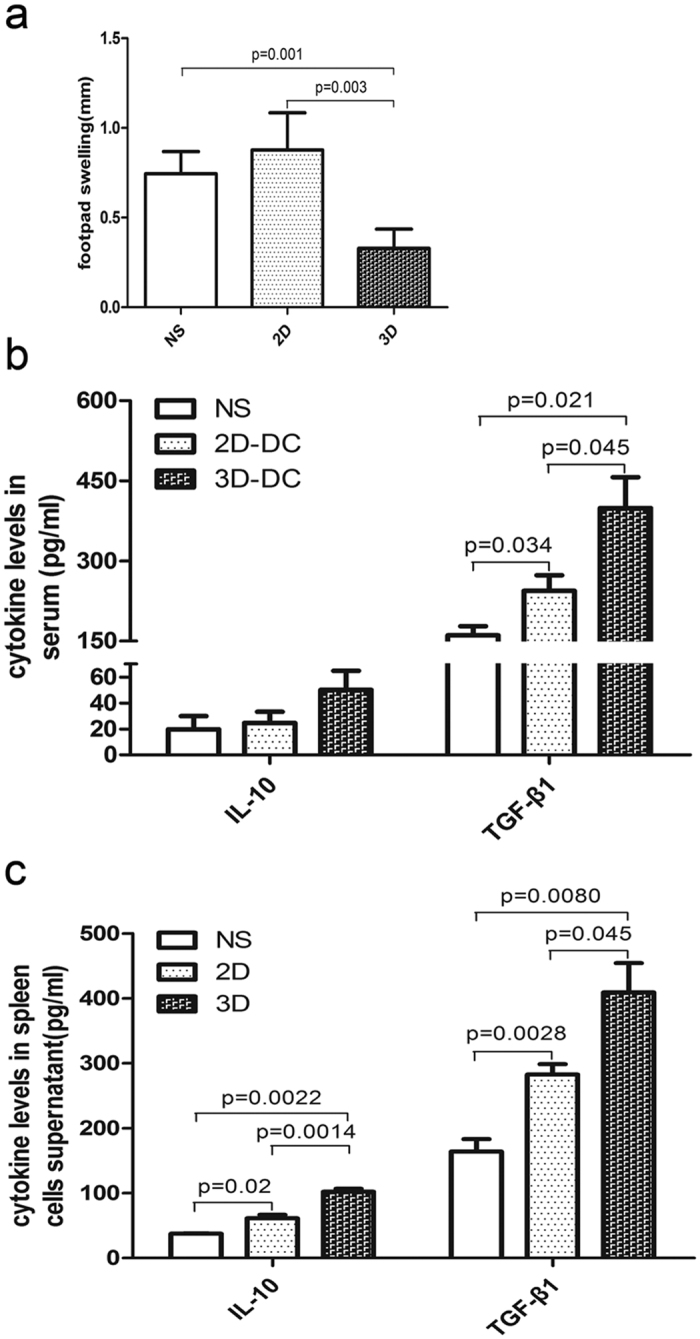
(a) Extent of footpad swelling of the experimental mice (n = 5). **P < 0.01 versus 2D, **P < 0.01 versus NS. (b) ELISA of IL-10 and TGF-β1 in the peripheral blood of experimental mice. *P < 0.05 versus mDC-2D and *P < 0.05 versus NS. (c) ELISA of IL-10 and TGF-β1 in the cell supernatant of spleen mononuclear cells of experimental mice. Data are shown as the mean ± SD of five samples. For IL-10 expression level analysis, *P < 0.05 versus NS, **P < 0.01 versus mDC-2D, and **P < 0.01 versus NS. For TGF-β1 expression level analysis, *P < 0.05 versus mDC-2D and ** P < 0.01 versus NS.