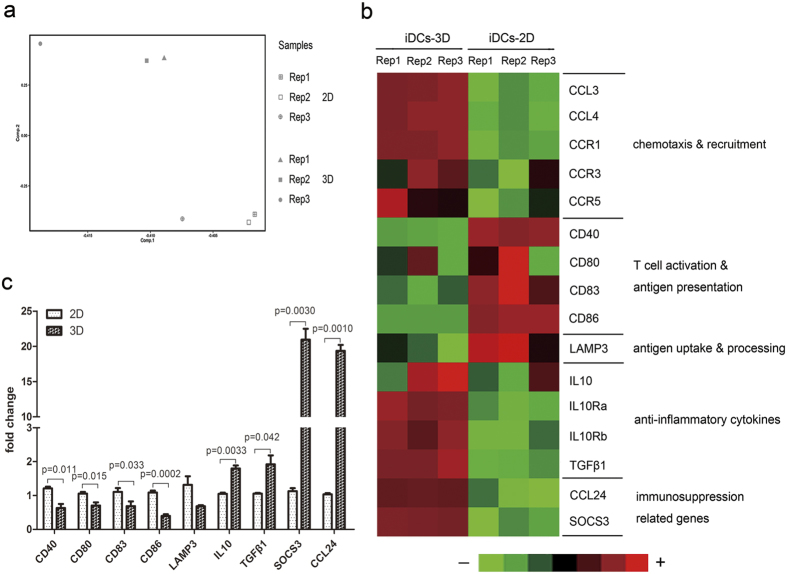
Figure 5. Microarray analyses of iDCs-2D and iDCs-3D.
(a) Diagram of the principal component analysis of iDCs-2D and iDCs-3D. (b) CD molecules and immune-related gene expression analysis of iDCs-2D and iDCs-3D using a transcriptome microarray. Light green represents minimal gene expression, and red shows maximum gene expression as indicated by the legend. (c) Quantitative RT-PCR analysis of the expression levels of CD molecules and immune-related genes in iDCs-2D and iDCs-3D. Data are shown as the mean ± SD of three samples. *P < 0.05 versus iDC-2D, **P < 0.01 versus iDC-2D.

