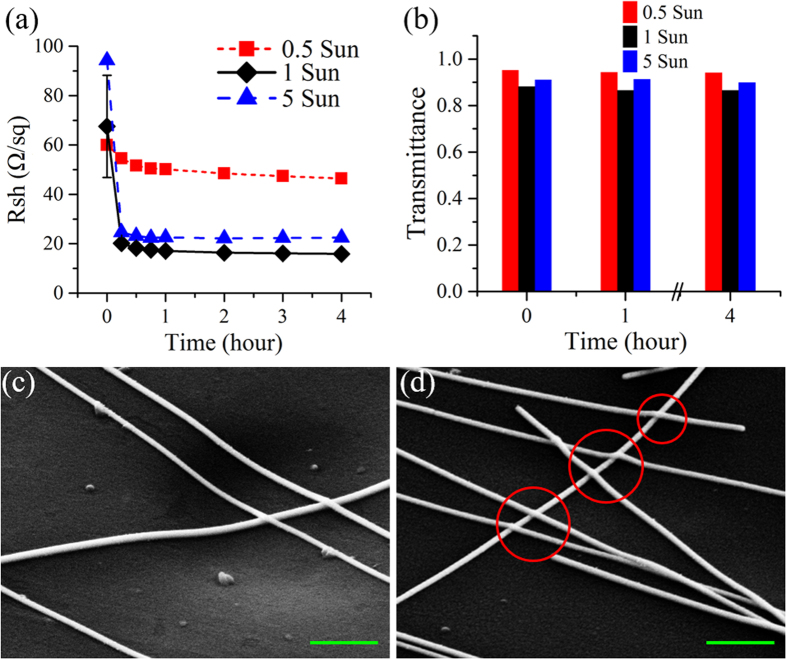
Figure 5.
(a) Sheet resistance (Rsh) as a function of treatment time for sunlight-illuminated samples with different power densities (red squares: 0.5 Sun; black diamonds: 1 Sun; blue triangles: 5 Sun), respectively. (b) Histogram of the light transmittance at 550 nm before and after different periods of time for all the treatments in (a). 45°-tilted SEM images of the samples after 4-hour sunlight illumination with concentration of (c) 0.5 Sun and (d) 5 Sun, respectively. Red circles indicate apparent welding between Ag NWs. Both scale bars are 500 nm.

