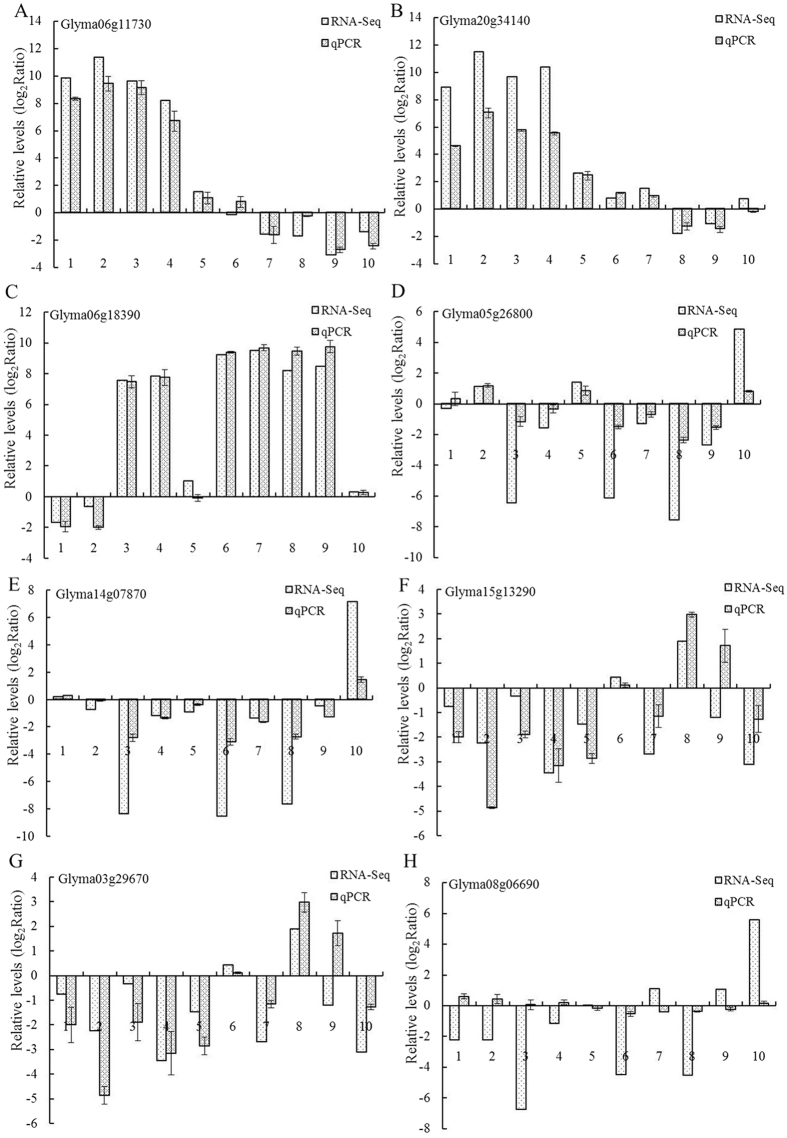
Figure 6. Comparison of expression rates determined by RNA-Seq and qPCR on 8 genes in soybean nodules.
Three biological replica samples were used, and all qPCR reactions were repeated three times and the data are presented as the mean ± SD. (A) Glyma06g11730. (B) Glyma20g34140. (C) Glyma06g18390. (D) Glyma05g26800. (E) Glyma14g07870. (F) Glyma15g13290. (G) Glyma03g29670. (H) Glyma08g06690. QACT was the reference gene for these qPCR experiments.

