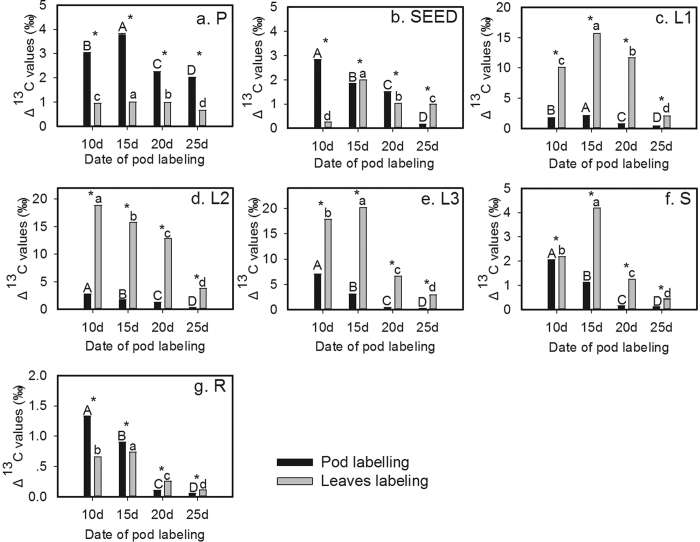
Figure 1. Changes for Δ13C values (‰) in the alfalfa organs (P, SEED, L1, L2, L3, S and R) according to the development stage (from day10 to 20 after podding) after pod or leaves labeling.
Each value represents the mean ± SE (n = 3). The different letters indicate significant differences (P < 0.01) among treatments as determined by the Tukey b-test. The capital and lowcase letter indicates pod and leaves labeling, respectively. *Indicate significant differences (P < 0.01) between pod and leaves labeling of samples as determined by the T test.

