
Figure 3. Metabolism in CQ-exposed T-cells.
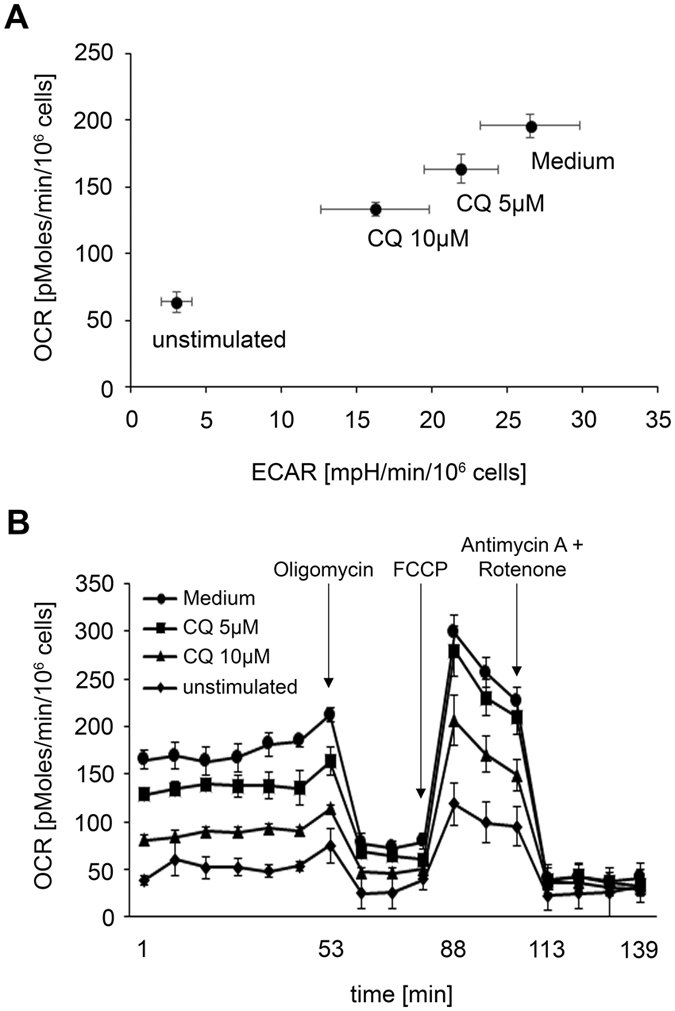
CD4+ T-cells were activated in the presence or absence (Medium) of the indicated concentrations of CQ and activated with anti-CD3/anti-CD28 antibodies or left unstimulated. After 48 hours, the extracellular acidification rate (ECAR; representing anaerobic glycolysis) and the oxygen consumption rate (OCR; representing mitochondrial respiration) were measured. (A) Mean ± SD from one representative donor (n = 5) (B) Mitochondrial stress test; At the indicated time points (arrows), the ATP coupling reagent oligomycin, the electron transfer chain uncoupling reagent FCCP, and the mitochondrial inhibitors rotenone/antimycin A were added. Data depict mean ± SD from quintuplet cultures from one representative donor (n = 5).