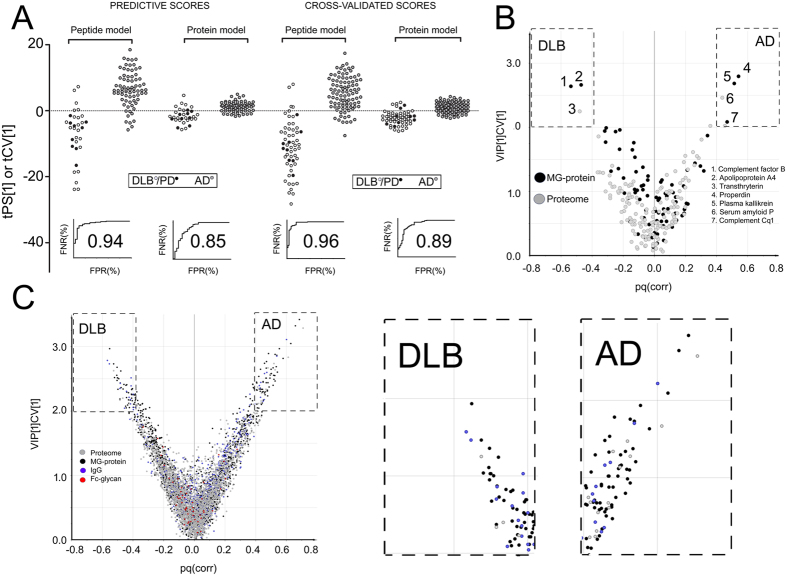
Figure 3. Multivariate combined models of the predictive scores of Group B and cross validated scores of Group A and Group B combined.
(A) Left, Predicted scores (tPS) of the Group B- and PD-patients (all treated as unknowns) in the combined OPLS-DA models (peptides and proteins) based on the differences in the AD- and DLB Group A patients. Right, the cross validated scores (tCV) of the combined OPLS-DA models (peptides and proteins) based on all patients. The predictive scores of the PD patients (still treated as unknowns) are also included in the plot. The corresponding ROC-curves of each model are shown below the compared patients. (B) Biomarker selection from the combined patient protein model using Variable Influence in Projection (VIP) values plotted against the p(corr) values. (C) Biomarker selection from the combined patient peptide model using Variable Influence in Projection (VIP) values plotted against the p(corr) values. Loading plots for proteins and peptides that correlated with >99% confidence with each sub-domain are given in Supplementary Table 3.

