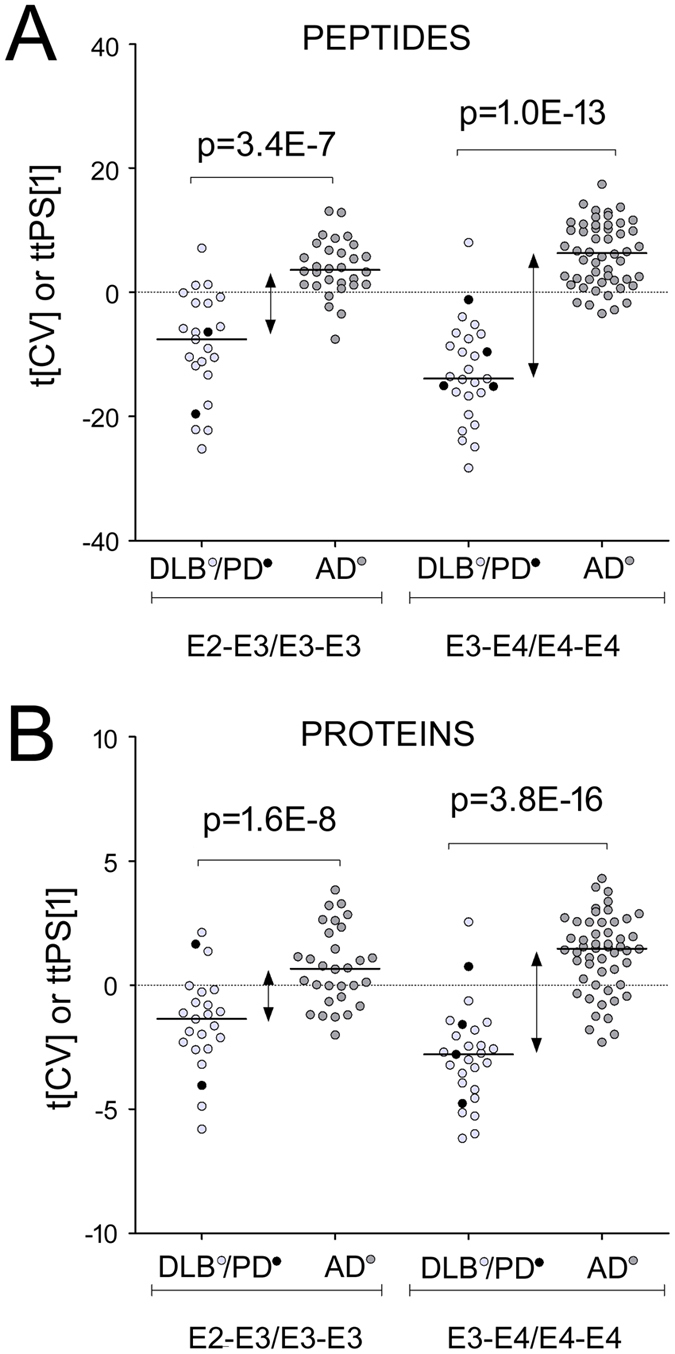
Figure 4.

(A) The Cross-Validated scores from the multivariate combined peptide-based model of the complete dataset (Fig. 3A). Patients are divided according to known Apolipoprotein E genotypes (E2-E3 and E3-E3, n = 51 versus E3-E4 and E4-E4, n = 75) and disease type. (B) The Cross-Validated scores from the multivariate combined protein model of the complete dataset (Fig. 3A), divided according to Apolipoprotein E genotypes and disease type. Marked out lines in the plots represent the medians.
