
Figure 2. Venn Drawing showing the unique and shared OTUs of all samples.
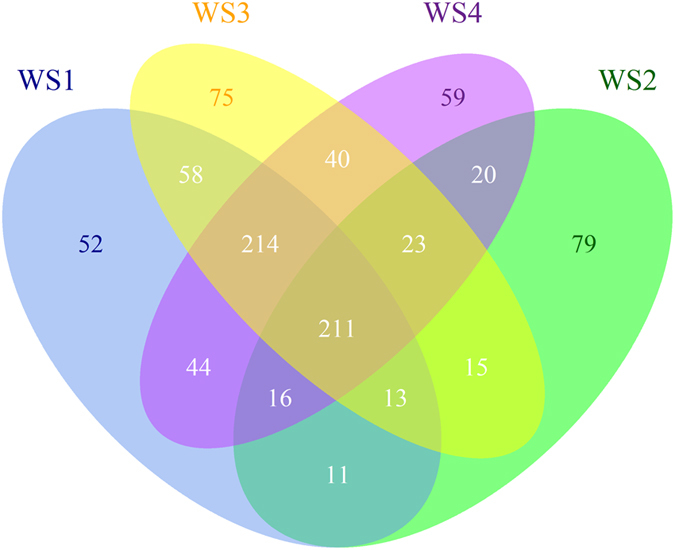
The three replicates were calculated and exhibited as a single sample named WS1, WS2, WS3, and WS4.
Official websites use .gov
A
.gov website belongs to an official
government organization in the United States.
Secure .gov websites use HTTPS
A lock (
) or https:// means you've safely
connected to the .gov website. Share sensitive
information only on official, secure websites.
The three replicates were calculated and exhibited as a single sample named WS1, WS2, WS3, and WS4.