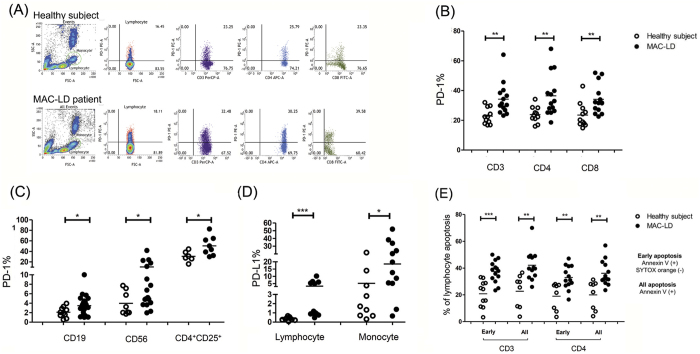
Figure 2. Programmed cell death-1 (PD-1), PD ligand-1 (PD-L1), and apoptosis expressions in peripheral blood lymphocytes and monocytes were measured by flow cytometry.
The results shown are (A) case demonstration and (B,C,D and E) dot plots between the controls and patients with Mycobacterium avium complex-lung disease (MAC-LD). We discriminated the lymphocytes (red circles) and monocytes (green circles) by forward scatter (FSC) and side scatter (SSC). We first gated the lymphocyte markers CD3, CD19 and CD56, and CD14 for monocytes. We then gated CD4 and CD8 in CD3-positive lymphocytes and CD25 in CD4-positive lymphocytes. In Figure 2D, we identified monocyte by CD14 positive cells in the monocyte population whereas lymphocyte population was defined by FSC and SSC (Fig. 2D). The crossed lines in the dot plots (B-E) are mean values. The data were compared using the Mann Whitney U test. *0.01 ≤ p < 0.05. Apoptosis was assessed by Annexin V and SYTOX orange staining. Early apoptosis was defined as Annexin V (+) and SYTOX orange (−), while overall apoptosis was defined as Annexin V (+) regardless of the SYTOX orange results.

