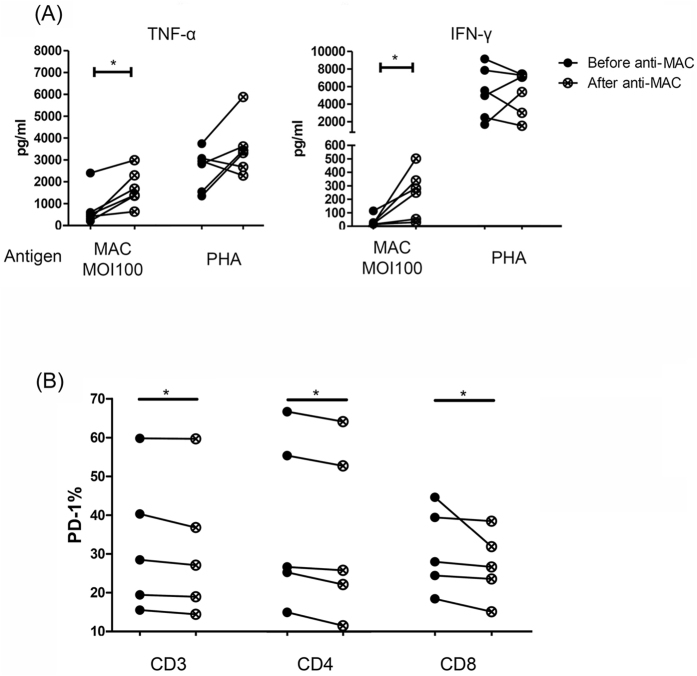
Figure 3.
(A) Cytokine response (n = 6) and (B) programmed cell death-1 (PD-1) expression (n = 5) were measured before and after 2 months of treatment for Mycobacterium avium complex lung disease (MAC-LD), and intra-subject changes were compared using the Wilcoxon test. Cytokine responses were measured by assaying peripheral blood mononuclear cells for 48 h with heat-killed MAC bacilli (multiplicity of infection: 100), and phytohemaglutinin-L (PHA) (2.5 ng/ml) in patients with MAC-lung disease. The percentage of PD-1 is shown in the before-and-after graph with intra-subject comparisons. The average PD-1 expression on CD3, CD4, and CD8 decreased from 32.7 ± 17.9% (mean ± standard deviation), 37.9 ± 22.2%, and 31.2 ± 11.2%, to 31.4 ± 18.0%, 35.4 ± 22.3%, and 27.3 ± 8.9%, respectively (all p < 0.05, Wilcoxon test). *0.01 ≤ p < 0.05. TNF-α, tumor necrosis factor-alpha; IFN-γ, interferon-gamma.

