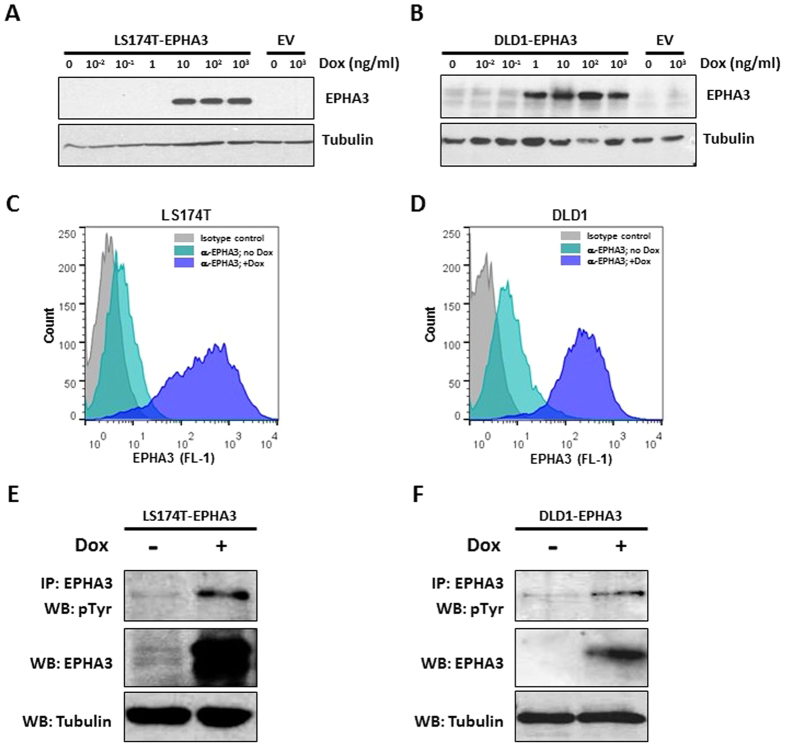
Figure 1. Inducible EPHA3 overexpression in colon cancer cell lines.
(A,B) Western blot showing the levels of EPHA3 protein in LS174T (A) and DLD1 (B) cells stably transfected with pLenti/TO-EPHA3 or the control empty vector (EV) after treatment with the indicated concentrations of doxycycline for 48 h. Tubulin levels are shown as a loading control. (C,D) Cell surface levels of EPHA3 following induction with doxycycline (1 μg/ml; 48 h) were assessed by flow cytometry analysis in LS174T-EPHA3 (C) and DLD1-EPHA3 (D). (E,F) The levels of EPHA3 phosphorylation after doxycycline treatment (1 μg/ml) for 48 h were determined by immunoprecipitation with anti-EPHA3 and Western blotting with anti-phospho-Tyrosine. Total input levels of EPHA3 and tubulin are also shown for LS174T-EPHA3 (E) and DLD1-EPHA3 (F).

