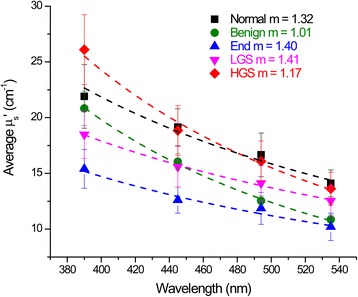
Fig. 2.

Wavelength dependence of the reduced scattering coefficient μ s′ over the wavelength range used for SHG imaging (390–535 nm) for the normal stroma and ovarian tumors. The best fit to the scattering power law from the corresponding m factor is shown with the experimental data. All curves are the average response from normal n = 4; benign n = 4; endometrioid n = 3; LGS n = 4; and HGS n = 3. Error bars are standard error
