
Fig. 3.
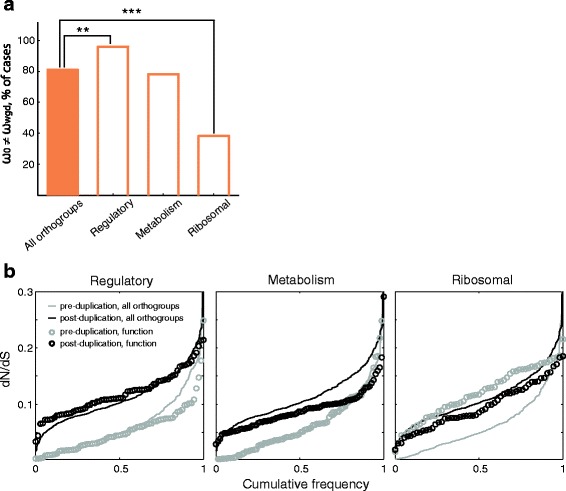
Different protein functions show different patterns of evolution before and after WGD. a Fraction of orthogroups for which the alternative hypothesis (ω0 ≠ ωwgd) is accepted; plot shows data for all orthogroups and different functional categories. Functional categories which are enriched or depleted in ω-change orthogroups are shown (**p < 0.01 and ***p < 0.001, χ 2 test). b Cumulative distribution plots of the dN/dS ratios for three different functional categories. Gray lines (all genes) and circles (specific function) show the pre-duplication dN/dS ratios; black lines and circles indicate post-duplication ratios