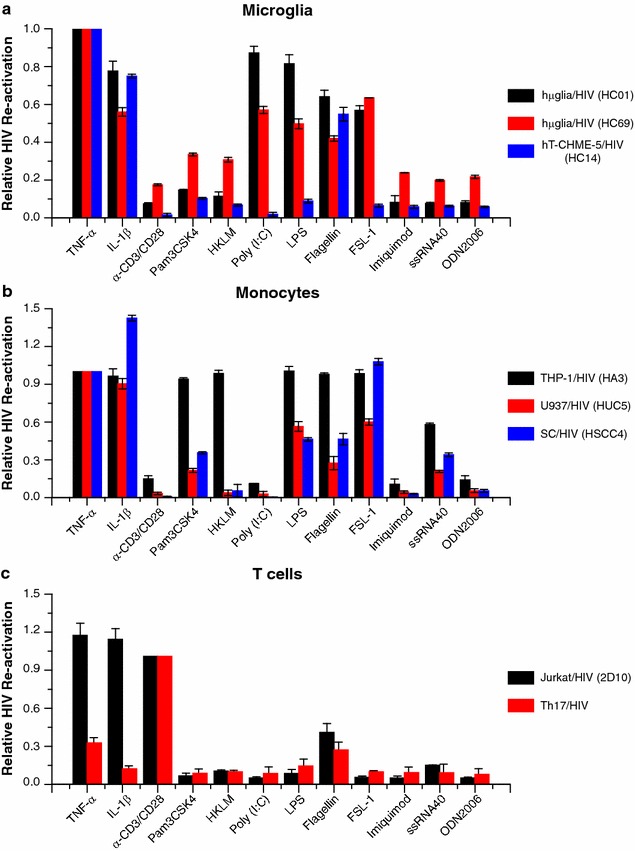
Fig. 5.

Relative induction (Y-axis) of HIV transcription by TLR ligands (X-axis). a Microglial cells are represented by hµglia/HIV (HC01; black bars), hµglia/HIV (HC69; red bars), and hT-CHME-5/HIV (HC14; blue bars). To compare the different cell lines, the data was normalized to TNF-α induction (100%). b The monocytic cells are represented by THP-1/HIV (HA3; black bars), U937/HIV (HUC5; red bars), and SC/HIV (HSCC4; blue bars). To compare the different cell lines, the data was normalized to TNF-α induction (100%). c T cells are represented by Jurkat/HIV (2D10; black bars) and Th17/HIV (mixed population; red bars). The data was normalized to α-CD3/CD28 induction levels (100%). Error bars indicate the standard deviation for three or more experiments
